32°57′45.31″N 85°36′59.24″W / 32.9625861°N 85.6164556°W
| Alabama's 3rd congressional district | |||
|---|---|---|---|
Interactive map of district boundaries | |||
| Representative |
| ||
| Area | 7,988 sq mi (20,690 km2) | ||
| Distribution |
| ||
| Population (2022) | 723,164[1] | ||
| Median household income | $54,047[2] | ||
| Ethnicity |
| ||
| Occupation |
| ||
| Cook PVI | R+19[3] | ||
.svg.png.webp)
.svg.png.webp)
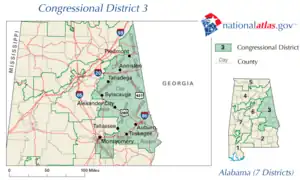
Alabama's 3rd congressional district is a United States congressional district in Alabama that elects a representative to the United States House of Representatives. It is based in east-central Alabama and encompasses Calhoun, Chambers, Cherokee, Clay, Cleburne, Lee, Macon, Randolph, Russell, St. Clair, Talladega, and Tallapoosa counties, and parts of Chilton County. Cities in the district include Phenix City, Talladega, Tuskegee, and Auburn. Prior to the most recent redistricting cycle, the 3rd district had included parts of the state capital city of Montgomery in Montgomery County.
At the federal level, the district is strongly Republican-leaning, though not quite as strongly as some of the other districts in the state. John McCain carried the district in 2008 with 56.21% of the vote while Barack Obama won 43.04% of the vote.
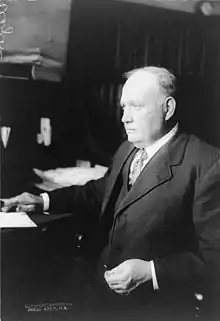
The district is currently represented by Republican Mike Rogers and was once represented by Bob Riley, the former Governor of Alabama.
Election results from statewide races
| Year | Office | Results |
|---|---|---|
| 2000 | President | Bush 52 - 47% |
| 2004 | President | Bush 58 - 41% |
| 2008 | President | McCain 56 - 43% |
| 2012 | President | Romney 62 - 37% |
| 2016 | President | Trump 64 - 33% |
| 2020 | President | Trump 65 - 34% |
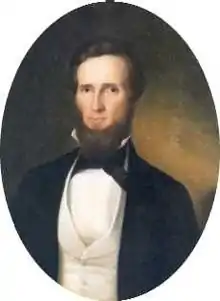
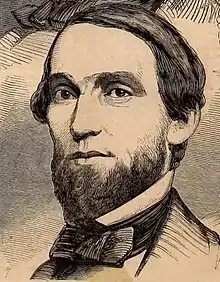
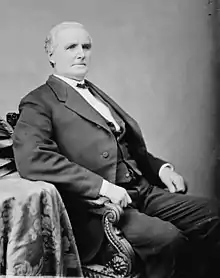
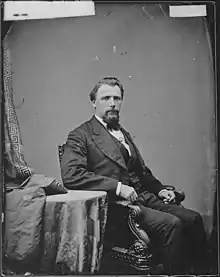
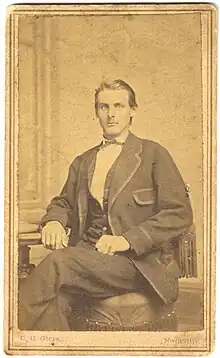
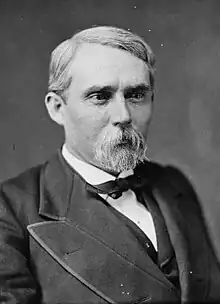
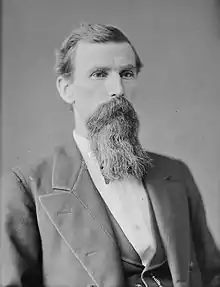
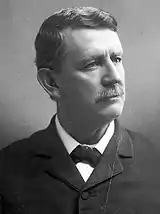
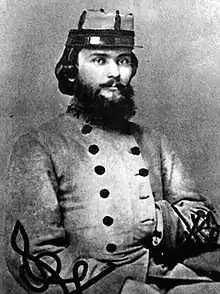
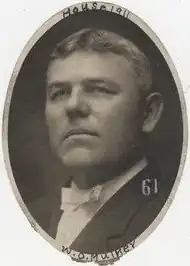
List of members representing the district

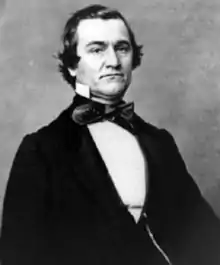
_-_James_La_Fayette_Cottrell.jpg.webp)


.tif.png.webp)
_(new_version).svg.png.webp)
Recent election results
These are the results from the previous ten election cycles in Alabama's 3rd district.[6]
2002
| Party | Candidate | Votes | % | |
|---|---|---|---|---|
| Republican | Mike Rogers | 91,169 | 50.31% | |
| Democratic | Joe Turnham | 87,351 | 48.20% | |
| Libertarian | George Crispin | 2,565 | 1.42% | |
| Write-in | 138 | 0.08% | ||
| Total votes | 181,223 | 100% | ||
| Republican hold | ||||
2004
| Party | Candidate | Votes | % | |
|---|---|---|---|---|
| Republican | Mike Rogers (incumbent) | 150,411 | 61.20% | |
| Democratic | Bill Fuller | 95,240 | 38.75% | |
| Write-in | 133 | 0.05% | ||
| Total votes | 245,784 | 100% | ||
| Republican hold | ||||
2006
| Party | Candidate | Votes | % | |
|---|---|---|---|---|
| Republican | Mike Rogers (incumbent) | 98,257 | 59.44% | |
| Democratic | Greg Pierce | 63,559 | 38.45% | |
| Independent | Mark Edwin Layfield | 3,414 | 2.07% | |
| Write-in | 71 | 0.04% | ||
| Total votes | 165,301 | 100% | ||
| Republican hold | ||||
2008
| Party | Candidate | Votes | % | |
|---|---|---|---|---|
| Republican | Mike Rogers (incumbent) | 150,819 | 53.39% | |
| Democratic | Joshua Segall | 131,299 | 46.48% | |
| Write-in | 367 | 0.13% | ||
| Total votes | 282,485 | 100% | ||
| Republican hold | ||||
2010
| Party | Candidate | Votes | % | |
|---|---|---|---|---|
| Republican | Mike Rogers (incumbent) | 117,736 | 59.42% | |
| Democratic | Steve Segrest | 80,204 | 40.48% | |
| Write-in | 199 | 0.10% | ||
| Total votes | 198,139 | 100% | ||
| Republican hold | ||||
2012
| Party | Candidate | Votes | % | |
|---|---|---|---|---|
| Republican | Mike Rogers (incumbent) | 175,306 | 64.00% | |
| Democratic | John Andrew Harris | 98,141 | 35.83% | |
| Write-in | 483 | 0.18% | ||
| Total votes | 273,930 | 100% | ||
| Republican hold | ||||
2014
| Party | Candidate | Votes | % | |
|---|---|---|---|---|
| Republican | Mike Rogers (incumbent) | 103,558 | 66.12% | |
| Democratic | Jesse Smith | 52,816 | 33.72% | |
| Write-in | 246 | 0.16% | ||
| Total votes | 156,620 | 100% | ||
| Republican hold | ||||
2016
| Party | Candidate | Votes | % | |
|---|---|---|---|---|
| Republican | Mike Rogers (incumbent) | 192,164 | 66.93% | |
| Democratic | Jesse Smith | 94,549 | 32.93% | |
| Write-in | 391 | 0.14% | ||
| Total votes | 287,104 | 100% | ||
| Republican hold | ||||
2018
| Party | Candidate | Votes | % | |
|---|---|---|---|---|
| Republican | Mike Rogers (incumbent) | 147,770 | 63.72% | |
| Democratic | Mallory Hagan | 83,996 | 36.22% | |
| Write-in | 149 | 0.06% | ||
| Total votes | 231,915 | 100% | ||
| Republican hold | ||||
2020
| Party | Candidate | Votes | % | |
|---|---|---|---|---|
| Republican | Mike Rogers (incumbent) | 217,384 | 67.46% | |
| Democratic | Adia McClellan Winfrey | 104,595 | 32.46% | |
| Write-in | 255 | 0.08% | ||
| Total votes | 322,234 | 100% | ||
| Republican hold | ||||
2022
| Party | Candidate | Votes | % | |
|---|---|---|---|---|
| Republican | Mike Rogers (incumbent) | 135,602 | 71.2% | |
| Democratic | Lin Veasey | 47,859 | 25.1% | |
| Independent | Douglas Bell | 3,831 | 2.0 | |
| Libertarian | Thomas Casson | 3,034 | 1.6 | |
| Total votes | 190,326 | 100% | ||
| Republican hold | ||||
See also
References
- Specific
- ↑ "My Congressional District".
- ↑ "My Congressional District".
- ↑ "2022 Cook PVI: District Map and List". Cook Political Report. Retrieved January 10, 2023.
- ↑ "A New Nation Votes".
- ↑ "A New Nation Votes".
- ↑ "AL - District 03". Our Campaigns. Retrieved September 16, 2021.
- General
- Martis, Kenneth C. (1989). The Historical Atlas of Political Parties in the United States Congress. New York: Macmillan Publishing Company.
- Martis, Kenneth C. (1982). The Historical Atlas of United States Congressional Districts. New York: Macmillan Publishing Company.
- Congressional Biographical Directory of the United States 1774–present
- "Our Campaigns - Container Detail Page". www.ourcampaigns.com. Retrieved September 22, 2020.