| |||||||||||||||||||||||||||||||
All 28 seats in the General Council | |||||||||||||||||||||||||||||||
This lists parties that won seats. See the complete results below.
| |||||||||||||||||||||||||||||||
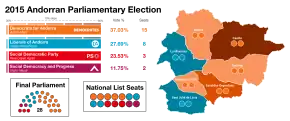
Parliamentary elections were held in Andorra on 1 March 2015.[1] Despite losing five seats, the Democrats for Andorra retained their majority in the General Council, winning 15 of the 28 seats.
Electoral system
The 28 members of the General Council were elected by two methods; 14 members were elected in two-member constituencies based on the seven parishes, whilst the remaining 14 were elected in a single nationwide constituency by proportional representation, with seats allocated using the largest remainder method.[2]
Opinion polls
| Pollster | Date | DA | PS | Vd'A | ApC | SPD | LDA | Others | Lead |
|---|---|---|---|---|---|---|---|---|---|
| Election results | 1 March 2015 | 39.4 | 23.6 | – | 9.5 | 27.5 | 11.8 | ||
| CRES | 26 January 2015 | 47.5 | 24.4 | 10.6 | 17.5 | 23.1 | |||
| CRES | 30 April 2014 | 53.2 | 29.4 | 7.9 | 9.5 | 23.8 | |||
| 2011 elections | 3 April 2011 | 55.1 | 34.8 | 3.4 | 6.7 | 20.3 | |||
Results
The Democrats for Andorra ran in alliance with United for Progress in Encamp, Communal Action of Ordino in Ordino, Massana Movement in La Massana, and the Coalition of Independents in Andorra la Vella. The Liberal Party ran in alliance with independent candidates in Encamp, Ordino and La Massana, and the Lauredian Union in Sant Julià de Lòria.
 | |||||||||
|---|---|---|---|---|---|---|---|---|---|
| Party | PR | Constituency | Total seats | +/– | |||||
| Votes | % | Seats | Votes | % | Seats | ||||
| Democrats for Andorra | 5,448 | 37.03 | 5 | 5,662 | 39.36 | 10 | 15 | –5 | |
| Liberal Party of Andorra | 4,073 | 27.69 | 4 | 3,962 | 27.54 | 4 | 8 | New | |
| PS+VERDS+IC+I | 3,462 | 23.53 | 3 | 3,393 | 23.59 | 0 | 3 | –3 | |
| Social Democracy and Progress | 1,728 | 11.75 | 2 | 1,367 | 9.50 | 0 | 2 | New | |
| Total | 14,711 | 100.00 | 14 | 14,384 | 100.00 | 14 | 28 | 0 | |
| Valid votes | 14,711 | 91.46 | 14,384 | 89.49 | |||||
| Invalid/blank votes | 1,373 | 8.54 | 1,689 | 10.51 | |||||
| Total votes | 16,084 | 100.00 | 16,073 | 100.00 | |||||
| Registered voters/turnout | 24,512 | 65.62 | 24,512 | 65.57 | |||||
| Source: Elections Andorra | |||||||||
By parish
| Parish | Constituency | PR | ||||||
|---|---|---|---|---|---|---|---|---|
| DA | LDA | PS | SDP | DA | LDA | PS | SDP | |
| Canillo | 80.7 | – | 19.3 | – | 56.6 | 22.1 | 12.9 | 8.5 |
| Encamp | 37.5 | 24.0 | 30.4 | 8.1 | 40.5 | 22.9 | 26.9 | 9.7 |
| Ordino | 37.8 | 36.3 | 19.4 | 6.6 | 36.5 | 31.1 | 23.2 | 9.3 |
| La Massana | 33.1 | 44.7 | 22.2 | – | 35.7 | 36.5 | 20.0 | 7.8 |
| Andorra la Vella | 36.8 | 20.7 | 25.7 | 16.7 | 34.5 | 27.6 | 22.1 | 15.9 |
| Sant Julià de Lòria | 29.8 | 47.5 | 14.9 | 7.9 | 24.3 | 48.2 | 19.1 | 8.4 |
| Escaldes-Engordany | 49.0 | 13.9 | 26.2 | 10.9 | 45.2 | 16.8 | 23.8 | 14.2 |
| Total | 39.4 | 27.5 | 23.6 | 9.5 | 37.0 | 27.7 | 23.5 | 11.7 |
Notes
References
- ↑ "Martí confirma les eleccions per a l'1 de març". Diari d'Andorra. 14 January 2015. Archived from the original on 26 February 2015.
- ↑ Electoral system IPU
