 |
| Geography of Macau |
|---|
| Other Macau topics |
| Macau Portal |
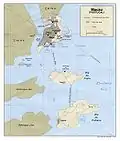
Macau is a Special Administrative Region on the southern coast of China. It is located at the south of Guangdong Province, on the tip of the peninsula formed by the Zhujiang (Pearl River) estuary on the east and the Xijiang (West River) on the west. Macau is situated 60 km (37 mi) west of Hong Kong, and 145 km (90 mi) southwest of Guangzhou, the capital of Guangdong Province. It is situated immediately east and south of Zhuhai.
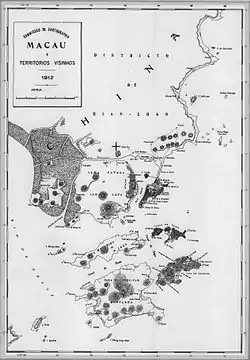
The region comprises the Macau Peninsula and the islands of Taipa and Coloane. Macau was once an island but gradually a connecting sandbar turned into a narrow isthmus. Land reclamation in the 17th century made Macau into a peninsula, and a barrier gate was built to mark the separation between the peninsula and the mainland. Pre-colonial records show that Macau totalled only 2.78 km2 (1.07 sq mi) but began to increase as a result of Portuguese settlement. Land growth has accelerated since the last quarter of the 20th century, from 15 km2 (5.8 sq mi) in 1972 to 16.1 km2 (6.22 sq mi) in 1983 to 21.3 km2 (8.22 sq mi) in 1994. Macau's size has gradually increased as result of continued land reclamation, especially on Taipa and Coloane. In 2014, the total land area was approximately 30.3 km2 (11.7 sq mi).
There is a 0.34 km (0.21 mi) long border between Macau and mainland China and a forty-kilometre-long coastline. The main border crossing between Macau and China is the Portas do Cerco (Barrier Gate) Frontier Checkpoint on the Macau side, and the Gongbei checkpoint on the Chinese side.
Location, size, border, and coastline
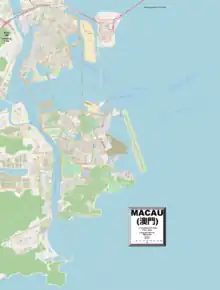
Geographic coordinates: 22°10′N 113°33′E / 22.167°N 113.550°E
Area
Land boundaries
- Total: 0.34 km
- Border city: Zhuhai, Guangdong Province 0.34 km
Coastline
- Coastline: 50.63 km
- Maritime claims: not specified
Topography



Location: Eastern Asia, bordering the South China Sea and China
Terrain: generally flat
Elevation extremes:
lowest point: South China Sea 0 m
highest point: Coloane Alto 172 m (564 ft)
List of highest hills in Macau SAR
| Name | Location | Notes | Height | Photo |
|---|---|---|---|---|
| Alto de Coloane | Coloane |
172.4m | ||
| Unnamed (Triangulation Pillar C6) | Coloane | 170.3m | ||
| Unnamed (Triangulation Pillar C4) | Coloane | 163.8m | ||
| Taipa Grande | Taipa | 160.4m | ||
| Unnamed (Triangulation Pillar T16) | Taipa | 152.9m | ||
| Ponto Central | Coloane | 138.1m | ||
| Monte de Ka Ho | Coloane | 132m | ||
| Unnamed (Triangulation Pillar C56) | Coloane | 126m | ||
| Morro de Artilharia | Coloane | 120m | ||
| Unnamed | Coloane | 114.8m | ||
| Taipa Pequena | Taipa | 112m | ||
| Unnamed (Triangulation Point C25) | Coloane | 108.8m | ||
| Guia Hill | Macau | 91.6m | ||
| Barra Hill | Macau | 74.4m | ||
| Ilha Verde hill | Macau | 54.5m |
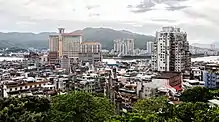
Macau has generally flat terrain resulting from extensive land reclamation, but numerous steep hills mark the original natural land mass. The modern high-rise skyline of Macau obscures much of the hilly landscape. The Macau skyline both defines and obscures its topography.
The Macau Peninsula is narrow in shape but varies in terrain.
Climate
| Macau | ||||||||||||||||||||||||||||||||||||||||||||||||||||||||||||
|---|---|---|---|---|---|---|---|---|---|---|---|---|---|---|---|---|---|---|---|---|---|---|---|---|---|---|---|---|---|---|---|---|---|---|---|---|---|---|---|---|---|---|---|---|---|---|---|---|---|---|---|---|---|---|---|---|---|---|---|---|
| Climate chart (explanation) | ||||||||||||||||||||||||||||||||||||||||||||||||||||||||||||
| ||||||||||||||||||||||||||||||||||||||||||||||||||||||||||||
| ||||||||||||||||||||||||||||||||||||||||||||||||||||||||||||
Although Macau is located in the tropics, it has a humid subtropical climate (Köppen climate classification Cwa), because the Siberian pressure system in the winter pushes cool air further south than similar semipermanent permanent high pressure systems. Its average year-round temperature is 22.7 °C (72.9 °F). Summers are very hot and humid: the July average temperature is 28.9 °C (84.0 °F) and the highest daytime temperature could reach 35 °C (95 °F). However, the heat is generally less intense than many places in mainland China due to the coastal location. Winters are short and mild: the January average is 15.0 °C (59.0 °F) and the lowest temperature could drop to 5 °C (41 °F), but very rarely any lower. There is about 2,120 millimetres (83 in) of rainfall annually, with drier winters.
Macau is exposed to tropical storms originating from the southern Pacific Ocean during the summer. Major destruction occurred in September 1874, when a devastating typhoon hit Macau and high seas swept across the low-lying area of the peninsula. There are always a few tropical storm occurrences in Macau each year (typically between May and October), although they vary in strengths. When they occur, they usually bring strong winds, rainfall and lower temperatures.
Prevailing winds and weather types change follow the monsoon pattern. It is warm and moist when the southeast and southwest winds are coming from the Pacific Ocean, and typhoons are relatively common during summertime. It is dry and slightly cold when the north winds are coming from Siberia or the northern part of Mainland China.
During the transition period from northeast monsoon to southwest monsoon (March and April), the weather is moist and foggy. It is Macau's spring season. Summer is from May to September, when the southeast and southwest monsoon prevailing. It is rather hot and rainy. The weather in autumn (the end of September and October) is sunny and warm, when the southwest monsoon withdrawing gradually and the northeast monsoon advancing south. It is generally regarded as the most comfortable season there. Winter is from November to February next year, when the northeast monsoon prevailing. It is mainly dry, with occasional cold fronts arriving.
There are moderate to high levels of humidity year-round, with an annual average of 79.3%. Annual sunshine totals are moderate, at more than 1800 hours.
| Climate data for Macau (1991–2020, extremes 1901–present) | |||||||||||||
|---|---|---|---|---|---|---|---|---|---|---|---|---|---|
| Month | Jan | Feb | Mar | Apr | May | Jun | Jul | Aug | Sep | Oct | Nov | Dec | Year |
| Record high °C (°F) | 29.1 (84.4) |
30.2 (86.4) |
31.5 (88.7) |
35.3 (95.5) |
37.5 (99.5) |
36.9 (98.4) |
38.9 (102.0) |
38.5 (101.3) |
38.1 (100.6) |
36.0 (96.8) |
34.2 (93.6) |
30.0 (86.0) |
38.9 (102.0) |
| Mean daily maximum °C (°F) | 18.6 (65.5) |
19.2 (66.6) |
21.4 (70.5) |
25.1 (77.2) |
28.7 (83.7) |
30.5 (86.9) |
31.4 (88.5) |
31.5 (88.7) |
30.8 (87.4) |
28.5 (83.3) |
24.7 (76.5) |
20.3 (68.5) |
25.9 (78.6) |
| Daily mean °C (°F) | 15.2 (59.4) |
16.1 (61.0) |
18.6 (65.5) |
22.3 (72.1) |
25.8 (78.4) |
27.8 (82.0) |
28.4 (83.1) |
28.3 (82.9) |
27.5 (81.5) |
25.1 (77.2) |
21.3 (70.3) |
16.9 (62.4) |
22.8 (73.0) |
| Mean daily minimum °C (°F) | 12.7 (54.9) |
13.9 (57.0) |
16.5 (61.7) |
20.3 (68.5) |
23.7 (74.7) |
25.7 (78.3) |
26.1 (79.0) |
25.9 (78.6) |
25.1 (77.2) |
22.7 (72.9) |
18.8 (65.8) |
14.3 (57.7) |
20.5 (68.9) |
| Record low °C (°F) | −1.8 (28.8) |
0.4 (32.7) |
3.2 (37.8) |
8.5 (47.3) |
13.8 (56.8) |
18.5 (65.3) |
19.3 (66.7) |
19.0 (66.2) |
13.2 (55.8) |
9.5 (49.1) |
5.0 (41.0) |
0.0 (32.0) |
−1.8 (28.8) |
| Average precipitation mm (inches) | 34.2 (1.35) |
43.9 (1.73) |
80.0 (3.15) |
153.5 (6.04) |
286.0 (11.26) |
373.7 (14.71) |
290.7 (11.44) |
331.4 (13.05) |
227.8 (8.97) |
75.1 (2.96) |
39.0 (1.54) |
31.3 (1.23) |
1,966.6 (77.43) |
| Average precipitation days | 5.8 | 8.9 | 11.4 | 11.6 | 14.1 | 17.7 | 16.6 | 16.2 | 12.3 | 6.2 | 4.9 | 5.0 | 130.9 |
| Average relative humidity (%) | 74.9 | 80.5 | 85.0 | 86.3 | 84.9 | 84.6 | 82.7 | 82.1 | 78.3 | 72.5 | 72.6 | 70.8 | 79.6 |
| Mean monthly sunshine hours | 127.1 | 79.1 | 71.3 | 84.0 | 136.4 | 156.0 | 223.2 | 195.3 | 177.0 | 192.2 | 171.0 | 158.1 | 1,770.7 |
| Mean daily sunshine hours | 4.1 | 2.8 | 2.3 | 2.8 | 4.4 | 5.2 | 7.2 | 6.3 | 5.9 | 6.2 | 5.7 | 5.1 | 4.8 |
| Mean daily daylight hours | 11.0 | 11.4 | 12.0 | 12.7 | 13.2 | 13.5 | 13.3 | 12.9 | 12.3 | 11.6 | 11.1 | 10.8 | 12.2 |
| Percent possible sunshine | 37 | 25 | 19 | 22 | 33 | 39 | 54 | 49 | 48 | 53 | 51 | 47 | 40 |
| Average ultraviolet index | 7 | 9 | 11 | 12 | 12 | 12 | 12 | 12 | 11 | 9 | 7 | 7 | 10 |
| Source 1: Macao Meteorological and Geophysical Bureau[2][3] | |||||||||||||
| Source 2: Weather Atlas (sun data) [4] | |||||||||||||
Natural resources
Negligible. In the past, large amounts of granite were extracted from Macau's hills for use as building material.
Fresh water
Relying on water supply from the Xijiang River, in 2006 Macau suffered its worse crisis of salinity in freshwater during the dry season, which takes place in late winter and early spring.[5] To address salinity issues, as of 2018 three water supply pipelines to Macau have been built and a fourth pipeline was planned for completion in 2019.[6]
Land use and reclamation
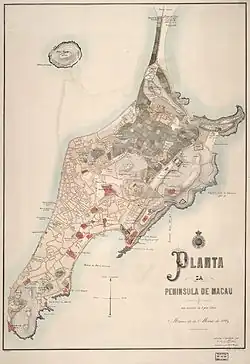
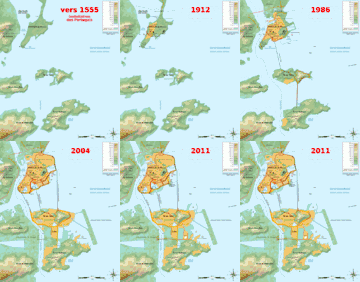
Until early 20th century, the Macau peninsula was dotted with small farms on its northern area, beyond the walls protecting the city. Currently, in the Macau peninsula, no arable land, natural pastures or woodland exists and forests have been cleared and plant species have been subjected to profound changes. Coloane on the other hand, due to its later colonisation, still has its forests and is dotted with small farms, namely around the Coloane, Hac Sa and Ka Ho villages.
arable land: 0%
permanent crops: 0%
other: 100% (2011)
In 2010 plans were announced for an additional 3.5 square kilometres of land reclamation in Macau, to be carried out over five years and divided into six phases. These areas cover an area east of the Outer Harbour Ferry Terminal, an area south of Avenida Sun Yat Sen, and the north side of Taipa Island.[7]
The change of total area of Macau (in km square) since the year of 1912:
- Note
- * - not included in "Total area of Macau"
| Year | Area of Macau Peninsula | Area of Taipa | Area of Coloane | Area of Cotai | Total area of Macau | Area of UM Hengqin* |
|---|---|---|---|---|---|---|
| 1912 | 3.4* | 2.3 | 5.9 | — | 11.6 | — |
| 1936 | 5.2 | 2.6 | 6.0 | — | 13.8 | — |
| 1957 | 5.5 | 3.3 | 6.3 | — | 15.1 | — |
| 1986 | 5.8 | 3.7 | 7.1 | — | 16.6 | — |
| 1991 | 6.5 | 4.0 | 7.6 | — | 18.1 | — |
| 1996 | 7.7 | 5.8 | 7.6 | — | 21.3 | — |
| 1999 | 7.8 | 6.2 | 7.6 | 2.2 | 23.8 | — |
| 2000 | 8.5 | 6.2 | 7.6 | 3.1 | 25.4 | — |
| 2001 | 8.5 | 6.2 | 7.6 | 3.5 | 25.8 | — |
| 2002 | 8.5 | 6.2 | 7.6 | 4.5 | 26.8 | — |
| 2003 | 8.7 | 6.2 | 7.6 | 4.7 | 27.3 | — |
| 2004 | 8.8 | 6.4 | 7.6 | 4.7 | 27.5 | — |
| 2005 | 8.9 | 6.5 | 7.6 | 5.2 | 28.2 | — |
| 2006 | 9.3 | 6.5 | 7.6 | 5.2 | 28.6 | — |
| 2007-08 | 9.3 | 6.7 | 7.6 | 5.6 | 29.2 | — |
| 2009 | 9.3 | 6.8 | 7.6 | 5.8 | 29.5 | — |
| 2010 | 9.3 | 6.8 | 7.6 | 6.0* | 29.7 | — |
| 2011-12 | 9.3 | 7.4 | 7.6 | 5.6 | 29.9 | — |
| 2013-14 | 9.3 | 7.6 | 7.6 | 5.8 | 30.3 | 1.0 |
| 2015 (Sept.) | 9.3 | 7.6 | 7.6 | 5.9 | 30.4 | 1.0 |
Environmental factors
Dense urban environment.
Geography – note: essentially urban; three bridges connect the two islands of Coloane and Taipa to the peninsula on mainland, and an isthmus connects Coloane and Taipa.
See also
References
- 1 2 "Macao to administrate 85 square kilometres of waters". Government Information Bureau of the MSARGovernment Information Bureau of the MSAR. Government of Macau. Retrieved 21 December 2015.
- ↑ "Macao Climate: 30-year Statistics of some meteorological elements". Macao Meteorological and Geophysical Bureau. Retrieved 19 March 2021.
- ↑ "Macao Climate: Extreme Value of some meteorological elements (1901-2020)". Macao Meteorological and Geophysical Bureau. Retrieved 19 March 2021.
- ↑ "Macau, China - Monthly weather forecast and Climate data". Weather Atlas. Retrieved 22 May 2023.
- ↑ Fox, Yi Hu (23 February 2006). "Fresh-water crisis looms for Macau". South China Morning Post. Retrieved 4 October 2020.
- ↑ Wong, Yi Wei (20 August 2018). "Macau | Fourth water supply pipeline will be built in 2019". Macau Business.com. Retrieved 4 October 2020.
- ↑ Alexandra Lages (19 June 2010). "Land reclamation to be done in the next 5 years". Macau Daily Times. Archived from the original on 9 October 2011. Retrieved 26 April 2011.
