| |||||||||||||||||||||||||||||||||||||
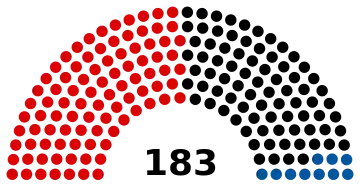
183 seats in the National Council of Austria 92 seats needed for a majority | |||||||||||||||||||||||||||||||||||||
|---|---|---|---|---|---|---|---|---|---|---|---|---|---|---|---|---|---|---|---|---|---|---|---|---|---|---|---|---|---|---|---|---|---|---|---|---|---|
| |||||||||||||||||||||||||||||||||||||
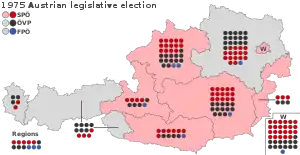 Results of the election, showing seats won by state and nationwide. States are shaded according to the first-place party. | |||||||||||||||||||||||||||||||||||||
| |||||||||||||||||||||||||||||||||||||

| This article is part of a series on the |
| Politics of Austria |
|---|
 |
|
Wöginger • Rendi-Wagner • Kickl • Maurer • Meinl-Reisinger •
|
|
|
|
|
Parliamentary elections were held in Austria on 5 October 1975.[1] The result was a victory for the Socialist Party, which won 93 of the 183 seats. Voter turnout was 93%.[2]
Results
 | |||||
|---|---|---|---|---|---|
| Party | Votes | % | Seats | +/– | |
| Socialist Party of Austria | 2,326,201 | 50.42 | 93 | 0 | |
| Austrian People's Party | 1,981,291 | 42.95 | 80 | 0 | |
| Freedom Party of Austria | 249,444 | 5.41 | 10 | 0 | |
| Communist Party of Austria | 55,032 | 1.19 | 0 | 0 | |
| Group of Revolutionary Marxists | 1,024 | 0.02 | 0 | New | |
| Steinacher Franz List | 440 | 0.01 | 0 | New | |
| Total | 4,613,432 | 100.00 | 183 | 0 | |
| Valid votes | 4,613,432 | 98.94 | |||
| Invalid/blank votes | 49,252 | 1.06 | |||
| Total votes | 4,662,684 | 100.00 | |||
| Registered voters/turnout | 5,019,277 | 92.90 | |||
| Source: Nohlen & Stöver | |||||
References
- ↑ Dieter Nohlen & Philip Stöver (2010) Elections in Europe: A data handbook, p196 ISBN 978-3-8329-5609-7
- ↑ Nohlen & Stöver, p215
| |||||||||||
| |||||||||||
This article is issued from Wikipedia. The text is licensed under Creative Commons - Attribution - Sharealike. Additional terms may apply for the media files.