| Season | 1976–77 |
|---|---|
← 1975–76 1977–78 → | |
Statistics of Belgian First Division in the 1976–77 season.
Overview

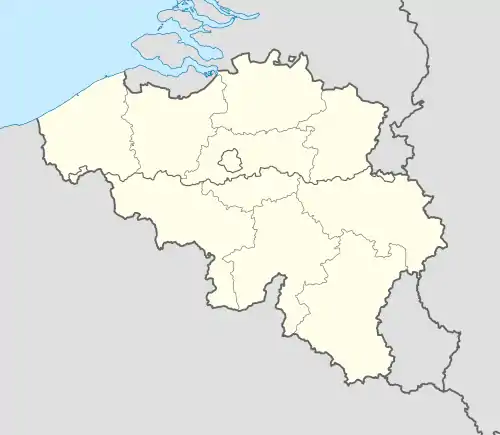
Location of teams in Belgian First Division 1976–77
It was contested by 18 teams, and Club Brugge K.V. won the championship.[1]
League standings
| Pos | Team | Pld | W | D | L | GF | GA | GD | Pts | Qualification or relegation |
|---|---|---|---|---|---|---|---|---|---|---|
| 1 | Club Brugge K.V. | 34 | 23 | 6 | 5 | 72 | 30 | +42 | 52 | Qualified for 1977–78 European Cup |
| 2 | R.S.C. Anderlecht | 34 | 21 | 6 | 7 | 74 | 37 | +37 | 48 | Qualified for 1977–78 European Cup Winners' Cup |
| 3 | Standard Liège | 34 | 18 | 9 | 7 | 51 | 26 | +25 | 45 | Qualified for 1977–78 UEFA Cup |
| 4 | R.W.D. Molenbeek | 34 | 18 | 8 | 8 | 62 | 37 | +25 | 44 | |
| 5 | K.S.C. Lokeren Oost-Vlaanderen | 34 | 15 | 8 | 11 | 53 | 39 | +14 | 38 | |
| 6 | K.S.V. Waregem | 34 | 14 | 7 | 13 | 46 | 39 | +7 | 35 | |
| 7 | Royal Antwerp FC | 34 | 13 | 9 | 12 | 43 | 49 | −6 | 35 | |
| 8 | Cercle Brugge K.S.V. | 34 | 12 | 11 | 11 | 58 | 53 | +5 | 35 | |
| 9 | Beerschot | 34 | 11 | 13 | 10 | 58 | 51 | +7 | 35 | |
| 10 | Lierse S.K. | 34 | 14 | 6 | 14 | 47 | 50 | −3 | 34 | |
| 11 | FC Winterslag | 34 | 12 | 8 | 14 | 44 | 45 | −1 | 32 | |
| 12 | K.V. Kortrijk | 34 | 11 | 10 | 13 | 42 | 47 | −5 | 32 | |
| 13 | K.S.K. Beveren | 34 | 11 | 9 | 14 | 35 | 43 | −8 | 31 | |
| 14 | Beringen FC | 34 | 8 | 10 | 16 | 40 | 57 | −17 | 26 | |
| 15 | R.F.C. de Liège | 34 | 10 | 5 | 19 | 39 | 79 | −40 | 25 | |
| 16 | R. Charleroi S.C. | 34 | 8 | 9 | 17 | 30 | 50 | −20 | 25 | |
| 17 | KV Mechelen | 34 | 6 | 8 | 20 | 38 | 67 | −29 | 20 | Relegated to Division II |
| 18 | A.S.V. Oostende K.M. | 34 | 6 | 8 | 20 | 39 | 72 | −33 | 20 |
Source:
Results
References
- ↑ Ploquin, Phil; Nackaerts, Luc; Coolsaet, Jeroen. "Belgium – Final Tables 1895–2008". The Rec.Sport.Soccer Statistics Foundation. Retrieved 17 December 2018.
This article is issued from Wikipedia. The text is licensed under Creative Commons - Attribution - Sharealike. Additional terms may apply for the media files.