Blitzortung (German for "lightning direction-finding", German pronunciation: [ˈblɪtsˌɔʁtʊŋ]) is an informal, non-commercial group of citizen scientists supported by professional scientists. Active since 2005,[1] station operators manage a worldwide network of 1797 active VLF radio wave receiver stations in 83 countries.[2] These receivers are used to determine the location of lightning strikes based on time-of-flight detector measurements of the received signals.[3][4] The only compensation that station operators receive is free access to the raw data of all stations. The data is processed by various websites using geoinformatics methods and made available on the Internet as a map display.[5][6]
Targets
The goal of Blitzortung.org is worldwide lightning detection with many inexpensive receiving stations. According to the website, such a station costs a maximum of $355 to build yourself.[7]
According to its own presentation, the interest group is "primarily aimed at private individuals with an interest in meteorology and expertise in the field of electrical and computer technology." There is no formal organisation behind it, there are no contracts and no fees or contributions are charged. The work is for personal edification only and is purely a hobby.[7]
Structure of the measuring stations

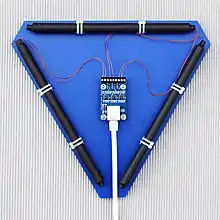
The measuring stations exist in various stages of expansion and development (see table below). Jointly developed receiver electronics serve as the basis for the construction of a separate station. The system is modular and can be equipped according to individual needs and possibilities. There is a choice between a rod antenna , which detects the electric field, and/or a magnetic antenna , which detects the H-field . The electric antenna does not provide any directional information, while the magnetic antenna consists of two or three orthogonal coils or ferrite rod antennae, which provide information about the orientation of the magnetic field. The stations can also be equipped with digital filters for better interference suppression.
| Date | Name | Version | Description |
|---|---|---|---|
| 2011 | System Green | PCB 6.6 | RS-232 interface |
| 2012 | System Green | PCB 6.8usb | USB interface |
| 2013 | System Red | PCB | 32-bit ARM Cortex-M4F, stand-alone operation, integrated GPS |
| 2016 | System Blue | PCB 19.4 | Similar to System Red, but SMD technology |
Detection method


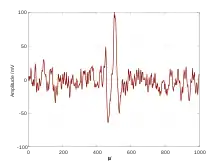
The stations continuously digitise the low-frequency signals from the antennas in the range from 3000 to 30000 Hz with a sampling rate of over 500 kHz. In this frequency range, the flashes generate particularly clear signal deflections, which lead to atmospheric interference in radio traffic and can generally also be perceived as crackling noises with a conventional AM radio in long and medium wave broadcasting.At the same time, a GPS signal is received and analysed. This is used to determine the exact location of the respective receiving station and at the same time provides a highly precise, common time base.
The Blitzortung method is based on the time of arrival (ToA) principle.[9]
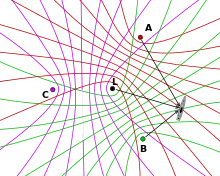
If a lightning signal is detected, it is sent to a central server for evaluation. If at least three lightning signals from different stations arrive at the server within a short time window, the server can determine the distance to the respective receiver from the arrival times of the signals. Figuratively speaking, the server draws a hyperbola line around two of the receivers, which can be calculated from the propagation time of the signals around each station. The signal from the third receiver is used as a time reference for the calculation. The point of impact is where the hyperbolas intersect. This method is generally referred to in surveying technology as multilateration , whereby the hyperlocation used here represents a special case of this, in which the points of equal time difference lie on hyperbola lines in the plane. Usually, significantly more than three receivers are involved, which improves the accuracy.[10]
Due to the long range of the signals, which occur at altitudes of a few kilometres - up to 100 kilometres in the case of so-called sprites - a large coverage can be achieved with a relatively thin station network.[11] The closer the stations are to the impact site and the more stations pick up the signal, the more precise the localisation.
Media reception
The findings, data and maps from Blitzortung.org repeatedly attract attention in the German and international media. In March 2015, the programme alle wetter! ("all about weather") on Hessischer Rundfunk reported on the network and its background.
According to the website, such a station costs a maximum of $355 to build yourself.[7] According to its own description, the interest group is "primarily aimed at private individuals with an interest in meteorology and expertise in the field of electrical and computer technology." There is no formal organisation behind it, there are no contracts and no fees or contributions are charged. The work is for personal edification only and is purely a hobby.[7][12] The network's data bisects 2020 in a search for the starting locations of the Gospers Mountain bushfire and mega-blazes in New South Wales in Australia.[13]
Other lightning detection networks
There are several other lightning detection networks, most of which are commercially operated:
- ALDIS Austrian Lightning Detection & Information System [14]
- BLIDS from Siemens AG
- EUCLID European Cooperation for Lightning Detection
- NALDN North American Lightning Detection Network
- Tropical Rainfall Measuring Mission (satellite-based)
References
- ↑ "First mention of the network in wetter-board.de". 2020-08-19.
- ↑ "List of active stations". Blitzortung.org. 2020-08-21.
- ↑ Egon Wanke (2010-12-25). Blitzortung.org (ed.). A low cost Time of Arrival Lightning Location Network (PDF) (Monograph). Düsseldorf. pp. 39–41.
{{cite book}}: CS1 maint: location missing publisher (link) - ↑ A. Shvets, T. Serdiuk, A. Krivonos, M. Hayakawa (2018). "Automatic Method for Monitoring the Lower Ionosphere and Lightning Location by Tweek-Atmospherics". 2018 International Symposium on Electromagnetic Compatibility (EMC EUROPE). International Symposium on Electromagnetic Compatibility (EMC EUROPE), Amsterdam: IEEE. pp. 789–794. doi:10.1109/EMCEurope.2018.8485180. ISBN 978-1-4673-9698-1. S2CID 52929374.
{{cite book}}: CS1 maint: multiple names: authors list (link) - ↑ "Aktuelle Blitzkarten auf Blitzortung.org". Blitzortung.org. 2020-08-16.
- ↑ "Aktuelle Blitzkarten auf lightningmaps.org". Blitzortung.org. 2020-08-16.
- 1 2 3 4 "Selbstdarstellung auf Blitzortung.org". 2020-08-20.
- ↑ "News page of Blitzortung.org". 2020-08-19.
- ↑ Wanke, Egon; Andersen, Richo; Volgnandt, Tobias (2023-06-21). A World-Wide Low-Cost Community-Based Time-of-Arrival Lightning Detection and Lightning Location Network (PDF) (Project Description - (14 February 2016, 11:10)). Event occurs at 10597. pp. 10–12.
{{cite book}}: CS1 maint: multiple names: authors list (link) - ↑ Viviane Wolff (2012). J. Strobl, T. Blaschke, G. Griesebner (ed.). Integration of lightning data from Blitzortung. org zur Darstellung in OSM (PDF). Angewandte Geoinformatik 2012. Herbert Wichmann Verlag, VDE VERLAG GMBH, Berlin/Offenbach. pp. 150–155. ISBN 978-3-87907-520-1.
{{cite book}}: CS1 maint: multiple names: editors list (link) - ↑ L. V. Sorokin (2020-08-17) [2016]. A. Chilingarian (ed.). The First Sprite Observation from Moscow in the Direction of Tver Region Associated with Repetitive Lightning Discharge. Proceedings of International Symposium TEPA 2016: Thunderstorms and Elementary Particle Acceleration. Yerevan Physics Institute, Armenia. p. 158.
- ↑ Georgina Laud (2020-08-14). "Lightning strike radar: where is the lightning striking NOW? Live maps". www.express.co.uk. Retrieved 2020-08-20.
Thunderstorms are forecast across the UK, with the Met Office issuing amber and yellow warnings - but where is the lightning striking NOW? Here are the latest live maps.
- ↑ "How the ABC tracked down the tree that started the Gospers Mountain bushfire and "mega-blaze" in Sydney". ABC News. August 2020. Retrieved 2020-08-20.
- ↑ Diendorfer, G.; Schulz, W. (May 2008). "ALDIS Austrian Lightning Detection and Information System 1992–2008". e & i Elektrotechnik und Informationstechnik. 125 (5). doi:10.1007/s00502-008-0530-3. S2CID 45801021.
External links
- Project website Blitzortung.org
- Dynamic map with live visualisation (worldwide) map.blitzortung.org