| 8th constituency of Bouches-du-Rhône | |
|---|---|
inline National Assembly of France | |
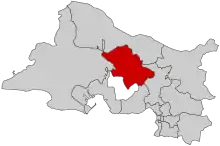
 Constituency in Bouches-du-Rhône Department (white area is the Étang de Berre lagoon) | |
 | |
| Deputy | |
| Department | Bouches-du-Rhône |
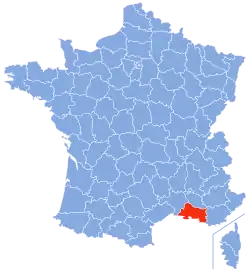
The 8th constituency of Bouches-du-Rhône is a French legislative constituency in Bouches-du-Rhône.
Deputies
| Election | Member | Party | |
|---|---|---|---|
| 1981 | Marius Masse | PS | |
| 1986 | Proportional Representation by Department | ||
| 1988 | Marius Masse | PS | |
| 1993 | |||
| 1997 | |||
| 2002 | Christophe Masse | ||
| 2007 | Valérie Boyer | UMP | |
| 2012 | Olivier Ferrand | PS | |
| 2012 | Jean-Pierre Maggi | ||
| 2017 | Jean-Marc Zulesi | LREM | |
| 2022 | RE | ||
Elections
2022
| Party | Candidate | Votes | % | ±% | |||
|---|---|---|---|---|---|---|---|
| LREM (Ensemble) | Jean-Marc Zulesi | 13,166 | 27.78 | -6.46 | |||
| RN | Romain Tonussi | 12,004 | 25.33 | +1.48 | |||
| LFI (NUPÉS) | Eric Deligny | 9,197 | 19.41 | +1.56 | |||
| LR (UDC) | David Ytier | 7,074 | 14.93 | -0.33 | |||
| REC | Jean-Michel Farge | 2,638 | 5.57 | N/A | |||
| ECO | Daniel Mehl | 1,254 | 2.65 | N/A | |||
| Others | N/A | 2,061 | |||||
| Turnout | 48,172 | 46.84 | -0.42 | ||||
| 2nd round result | |||||||
| LREM (Ensemble) | Jean-Marc Zulesi | 22,823 | 53.17 | -5.51 | |||
| RN | Romain Tonussi | 20,104 | 46.83 | +5.51 | |||
| Turnout | 42,927 | 44.77 | +2.96 | ||||
| LREM hold | |||||||
2017
| Candidate | Label | First round | Second round | |||
|---|---|---|---|---|---|---|
| Votes | % | Votes | % | |||
| Jean-Marc Zulesi | REM | 15,850 | 34.24 | 22,448 | 58.68 | |
| Antoine Baudino | FN | 11,041 | 23.85 | 15,807 | 41.32 | |
| Sandra Dalbin | LR | 7,062 | 15.26 | |||
| Nadia Graindorge | FI | 5,103 | 11.02 | |||
| Clément Acar | PS | 1,202 | 2.60 | |||
| Mathieu Saintagne | ECO | 1,029 | 2.22 | |||
| Christiane Pujol | DLF | 997 | 2.15 | |||
| Michel Frate | PCF | 931 | 2.01 | |||
| Michel Cantinol | ECO | 672 | 1.45 | |||
| Khaled Beghouach | DVG | 553 | 1.19 | |||
| Ange Tinelli | DIV | 365 | 0.79 | |||
| Christian Péri | DIV | 326 | 0.70 | |||
| Véronique Assiouras | PRG | 324 | 0.70 | |||
| Geneviève Monténéro | DIV | 248 | 0.54 | |||
| Jérôme Ravenet | ECO | 221 | 0.48 | |||
| Rémy Bazzali | EXG | 204 | 0.44 | |||
| Jean-Marie Mure-Ravaud | DVD | 158 | 0.34 | |||
| Votes | 46,286 | 100.00 | 38,255 | 100.00 | ||
| Valid votes | 46,286 | 97.84 | 38,255 | 91.41 | ||
| Blank votes | 729 | 1.54 | 2,623 | 6.27 | ||
| Null votes | 291 | 0.62 | 971 | 2.32 | ||
| Turnout | 47,306 | 47.26 | 41,849 | 41.81 | ||
| Abstentions | 52,788 | 52.74 | 58,243 | 58.19 | ||
| Registered voters | 100,094 | 100,092 | ||||
| Source: Ministry of the Interior[2] | ||||||
2012
| Candidate | Party | 1st round | 2nd round | ||||
|---|---|---|---|---|---|---|---|
| Votes | % | Votes | % | ||||
| Olivier Ferrand | Socialist Party | PS | 17,034 | 31.55% | 22,331 | 40.48% | |
| Nicolas Isnard | Union for a Popular Movement | UMP | 17,601 | 32.60% | 22,013 | 39.91% | |
| Gérald Gerin | Front National | FN | 11,863 | 21.97% | 10,816 | 19.61% | |
| Hélène Le Cacheux | Left Front | FG | 3,112 | 5.76% | |||
| Claude Cortesi | CEN | 1,439 | 2.67% | ||||
| Jean-Yves Pied | Far Right | EXD | 609 | 1.13% | |||
| Rosa Alba Silvestri | Radical Party of the Left | PRG | 581 | 1.08% | |||
| Jean Frizzi | Ecologist | ECO | 495 | 0.92% | |||
| Jean-François Dorbeaux | Miscellaneous Right | DVD | 322 | 0.60% | |||
| Hakim Hallalen | Centrist Alliance | ALLI | 259 | 0.48% | |||
| José-Ramon Guardia | Far Right | EXD | 225 | 0.42% | |||
| Denis Vial | Other | AUT | 200 | 0.37% | |||
| Antonia Luciani Garcia | Regionalist | REG | 133 | 0.25% | |||
| Frédéric Kechra | Far Left | EXG | 123 | 0.23% | |||
| Total | 53,996 | 100% | 55,160 | 100% | |||
| Registered voters | 93,086 | 93,083 | |||||
| Blank/Void ballots | 695 | 1.27% | 834 | 1.49% | |||
| Turnout | 54,691 | 58.75% | 55,994 | 60.15% | |||
| Abstentions | 38,395 | 41.25% | 37,089 | 39.85% | |||
| Result | PS GAIN | ||||||
2007
| Candidate | Party | 1st round | 2nd round | ||||
|---|---|---|---|---|---|---|---|
| Votes | % | Votes | % | ||||
| Valérie Boyer | Union for a Popular Movement | UMP | 17,077 | 41.16% | 20,872 | 50.24% | |
| Christophe Masse | Socialist Party | PS | 13,795 | 33.25% | 20,676 | 49.76% | |
| Stéphane Durbec | Front National | FN | 3,341 | 8.05% | |||
| Sonia Arzano | Democratic Movement | MoDem | 2,139 | 5.16% | |||
| Michèle Ledesma | Communist | PCF | 1,470 | 3.54% | |||
| Jean-Marie Battini | Far Left | EXG | 925 | 2.23% | |||
| Bruno Cocaign | The Greens | VEC | 492 | 1.19% | |||
| Francis Belotti | Movement for France | MPF | 488 | 1.18% | |||
| Denise Picq | Ecologist | ECO | 428 | 1.03% | |||
| Olga Dhamelincourt Pibarot | Miscellaneous Right | DVD | 269 | 0.65% | |||
| Françoise Latour | Ecologist | ECO | 249 | 0.60% | |||
| Gérard Fleury | Far Right | EXD | 245 | 0.59% | |||
| Patrick Grenier | Far Left | EXG | 228 | 0.55% | |||
| Abel Djerari | Independent | DIV | 215 | 0.52% | |||
| Elisabeth Harmitt | Independent | DIV | 127 | 0.31% | |||
| Emmanuelle Barreyre | Independent | DIV | 0 | 0.00% | |||
| Total | 41,488 | 100% | 41,548 | 100% | |||
| Registered voters | 74,134 | 74,123 | |||||
| Blank/Void ballots | 560 | 1.33% | 893 | 2.10% | |||
| Turnout | 42,048 | 56.72% | 42,441 | 57.26% | |||
| Abstentions | 32,086 | 43.28% | 31,682 | 42.74% | |||
| Result | UMP GAIN | ||||||
2002
| Party | Candidate | Votes | % | ±% | |||
|---|---|---|---|---|---|---|---|
| PS | Christophe Masse | 13,996 | 35.66 | ||||
| UDF | Jacques Rocca Serra | 10,521 | 26.81 | ||||
| FN | Stephane Durbec | 8,276 | 21.09 | ||||
| DVD | Alain Persia | 1,470 | 3.75 | ||||
| MNR | Yvon Claire | 1,209 | 2.08 | ||||
| Others | N/A | 3,771 | |||||
| Turnout | 39,934 | 62.06 | |||||
| 2nd round result | |||||||
| PS | Christophe Masse | 16,241 | 44.56 | ||||
| UDF | Jacques Rocca Serra | 13,426 | 36.84 | ||||
| FN | Stephane Durbec | 6,777 | 18.60 | ||||
| Turnout | 37,095 | 57.65 | |||||
| PS hold | |||||||
1997
| Party | Candidate | Votes | % | ±% | |||
|---|---|---|---|---|---|---|---|
| PS | Marius Masse | 10,455 | 28.88 | ||||
| FN | Yvon Claire | 10,199 | 28.18 | ||||
| RPR | Maurice Talazac | 7,456 | 20.60 | ||||
| PCF | Rudy Vigier | 4,829 | 13.34 | ||||
| LO | Claudine Rodinson | 918 | 2.54 | ||||
| Others | N/A | 2,341 | |||||
| Turnout | 37,377 | 61.93 | |||||
| 2nd round result | |||||||
| PS | Marius Masse | 21,968 | 59.06 | ||||
| FN | Yvon Claire | 15,225 | 40.94 | ||||
| Turnout | 40,454 | 67.03 | |||||
| PS hold | |||||||
References
- ↑ "Résultats des élections législatives 2022 dans les Bouches-du-Rhône". Le Monde.fr (in French). Retrieved 26 November 2022.
- ↑ "Résultats des élections législatives 2017" [Results of 2017 Legislative Election] (in French). Ministry of the Interior.
- ↑ "Résultats des élections législatives 2012".
- ↑ "Résultats des élections législatives 2007".
This article is issued from Wikipedia. The text is licensed under Creative Commons - Attribution - Sharealike. Additional terms may apply for the media files.