Didsbury West (Manchester) | |
|---|---|
_2018.png.webp) Didsbury West electoral ward within Manchester City Council | |
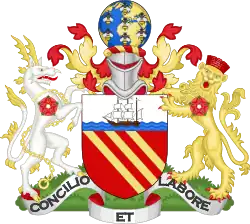
 Coat of arms | |
| Motto(s): By wisdom and effort | |
| Coordinates: 53°25′07″N 2°14′35″W / 53.4186°N 2.2431°W | |
| Country | United Kingdom |
| Constituent country | England |
| Region | North West England |
| County | Greater Manchester |
| Metropolitan borough | Manchester |
| Created | 2004 |
| Named for | Didsbury |
| Government UK Parliament constituency: Manchester Withington | |
| • Type | Unicameral |
| • Body | Manchester City Council |
| • Leader of the council | Bev Craig (Labour) |
| • Councillor | Richard Kilpatrick (Liberal Democrats) |
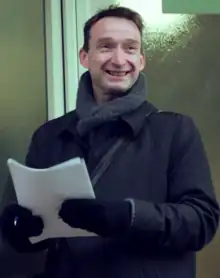
| • Councillor | John Leech (Liberal Democrats) |
| • Councillor | Debbie Hilal (Labour) |
| Population | |
| • Total | 12,455 |
| Area and population statistics from the 2011 Census[1] | |
Didsbury West is a suburb and electoral ward of Manchester, England.[2] It is represented in Westminster by Jeff Smith MP for Manchester Withington.[3] The 2011 Census recorded a population of 12,455.[1]
Councillors


 Debbie Hilal (Labour)
| Election | Councillor | Councillor | Councillor | |||
|---|---|---|---|---|---|---|
| 2004 | Simon Wheale (Lib Dem) | Neil Trafford (Lib Dem) | Graham Shaw (Lib Dem) | |||
| 2006 | Richard Clayton (Lib Dem) | Neil Trafford (Lib Dem) | Graham Shaw (Lib Dem) | |||
| 2007 | Richard Clayton (Lib Dem) | Neil Trafford (Lib Dem) | Graham Shaw (Lib Dem) | |||
| 2008 | Richard Clayton (Lib Dem) | Neil Trafford (Lib Dem) | Graham Shaw (Lib Dem) | |||
| By-election 29 January 2009[6][7] |
Richard Clayton (Lib Dem) | Lianne Williams (Lib Dem) | Graham Shaw (Lib Dem) | |||
| 2010 | Mark Clayton (Lib Dem) | Lianne Williams (Lib Dem) | Graham Shaw (Lib Dem) | |||
| 2011 | Mark Clayton (Lib Dem) | David Ellison (Lab) | Graham Shaw (Lib Dem) | |||
| 2012 | Mark Clayton (Lib Dem) | David Ellison (Lab) | Carl Ollerhead (Lab) | |||
| 2014 | Josie Teubler (Lab) | David Ellison (Lab) | Carl Ollerhead (Lab) | |||
| 2015 | Josie Teubler (Lab) | David Ellison (Lab) | Carl Ollerhead (Lab) | |||
| 2016 | Josie Teubler (Lab) | David Ellison (Lab) | John Leech (Lib Dem) | |||
| 2018 | David Ellison (Lab) | Richard Kilpatrick (Lib Dem) | John Leech (Lib Dem) | |||
| 2019 | Greg Stanton (Lib Dem) | Richard Kilpatrick (Lib Dem) | John Leech (Lib Dem) | |||
| 2020 | Greg Stanton (Lab) | Richard Kilpatrick (Lib Dem) | John Leech (Lib Dem) | |||
| 2021 | Greg Stanton (Lab) | Debbie Hilal (Lab) | John Leech (Lib Dem) | |||
| 2022 | Greg Stanton (Lab) | Debbie Hilal (Lab) | John Leech (Lib Dem) | |||
| 2023 | Richard Kilpatrick (Lib Dem) | Debbie Hilal (Lab) | John Leech (Lib Dem) | |||
indicates seat up for re-election. indicates seat won in by-election. indicates councillor changed party.
Elections in the 2020s
* denotes incumbent councillor seeking re-election.
May 2023
| Party | Candidate | Votes | % | ±% | |
|---|---|---|---|---|---|
| Liberal Democrats | Richard Kilpatrick | 2,260 | 44.3 | 5.9 | |
| Labour | Leslie Bell | 2,047 | 40.1 | 6.3 | |
| Green | James Young | 592 | 11.6 | 1.8 | |
| Conservative | Martin Cartwright | 153 | 3.0 | 0.9 | |
| SDP | Wendy Andrew | 26 | 0.5 | ||
| Majority | 213 | 4.2 | 12.2 | ||
| Rejected ballots | 23 | ||||
| Turnout | 5,101 | ||||
| Registered electors | 11,888 | ||||
| Liberal Democrats hold | Swing | 6.1 |
|||
Previous councillor Greg Stanton was elected for the Liberal Democrats in 2019 but defected to Labour; for the purpose of comparison to the 2019 figures this ward is a Lib Dem hold.
May 2022
| Party | Candidate | Votes | % | ±% | |
|---|---|---|---|---|---|
| Liberal Democrats | John Leech* | 2,760 | 53.8 | 1.4 | |
| Labour | Luke Savage | 1,863 | 36.3 | 5.2 | |
| Green | Sally Hawkins | 342 | 6.7 | 6.1 | |
| Conservative | Luke Bourke Costello | 123 | 2.4 | 3.6 | |
| SDP | Wendy Andrew | 22 | 0.4 | n/a | |
| Majority | 897 | 17.5 | |||
| Rejected ballots | 25 | ||||
| Turnout | 5,135 | 42.6 | 4.9 | ||
| Registered electors | 12,058 | ||||
| Liberal Democrats hold | Swing | 1.9 |
|||
May 2021
| Party | Candidate | Votes | % | ±% | |
|---|---|---|---|---|---|
| Labour | Debbie Hilal | 2,523 | 44.9 | ||
| Liberal Democrats | Richard Kilpatrick* | 2,282 | 40.6 | ||
| Green | Jake Welsh | 408 | 7.3 | ||
| Conservative | Luke Bourke Costello | 309 | 5.5 | ||
| Women's Equality | Sarika Paul | 72 | 1.3 | New | |
| SDP | Wendy Andrew | 29 | 0.5 | New | |
| Majority | 241 | 4.3 | |||
| Rejected ballots | 31 | 0.6 | |||
| Turnout | 5,654 | 45.8 | 1.7 | ||
| Registered electors | 12,335 | ||||
| Labour gain from Liberal Democrats | Swing | 3.8 |
|||
Elections in the 2010s
May 2019
| Party | Candidate | Votes | % | ±% | |
|---|---|---|---|---|---|
| Liberal Democrats | Greg Stanton | 2,214 | 50.2% | ||
| Labour | David Ellison* | 1,490 | 33.8% | ||
| Green | Arnold Spencer | 430 | 9.8% | ||
| Conservative | Anjenarra Haque | 170 | 3.9% | ||
| Women's Equality | Sarika Paul | 85 | 1.9% | N/A | |
| Majority | 724 | 16.4% | |||
| Rejected ballots | 18 | 0.73% | |||
| Turnout | 4,407 | 37.60% | |||
| Registered electors | 11,717 | ||||
| Liberal Democrats gain from Labour | Swing | ||||
May 2018
| Party | Candidate | Votes | % | ±% | |
|---|---|---|---|---|---|
| Liberal Democrats | John Leech* | 2,524 | 55.2 | ||
| Liberal Democrats | Richard Kilpatrick | 1,994 | 43.6 | ||
| Labour | David Ellison* | 1,899 | 41.5 | ||
| Liberal Democrats | Greg Stanton | 1,878 | 41.1 | ||
| Labour | Laura Wright | 1,781 | 39.0 | ||
| Labour | Peter Cookson | 1,567 | 34.3 | ||
| Green | Arnold Spencer | 587 | 12.8 | ||
| Conservative | Connor Walsh | 275 | 6.0 | ||
| Conservative | Thomas Beach | 271 | 5.9 | ||
| Conservative | Xin Shi | 206 | 4.5 | ||
| Majority | 21 | ||||
| Turnout | 4,571 | 47.5 | |||
| Liberal Democrats win (new boundaries) | |||||
| Liberal Democrats win (new boundaries) | |||||
| Labour win (new boundaries) | |||||
| Party | Candidates | Seats Won | Votes | Vote % | |
|---|---|---|---|---|---|
| Liberal Democrats | 3 | 2 | 6,396 | 49.27 | |
| Labour | 3 | 1 | 5,247 | 40.42 | |
| Conservative | 3 | 0 | 752 | 5.79 | |
| Green | 1 | 0 | 587 | 4.52 | |
May 2016
| Party | Candidate | Votes | % | ±% | |
|---|---|---|---|---|---|
| Liberal Democrats | John Leech | 2,295 | 52.61 | +24.5% | |
| Labour | Barnaby Edward Lane | 1,593 | 36.52 | -7.5% | |
| Green | Arnold James Spencer | 244 | 5.59 | -6% | |
| Conservative | Max Dowling | 161 | 3.69 | -12% | |
| UKIP | Robert Gutenfreund-Walmsley | 69 | 1.58 | -2% | |
| Majority | 702 | 16.09 | |||
| Turnout | 4,362 | 44.40 | |||
| Liberal Democrats gain from Labour | Swing | 16.2% | |||
- Leech's win signified the first gain for any party in Manchester other than Labour for the first time in six years and provided Manchester with its first opposition for two years.
May 2015
| Party | Candidate | Votes | % | ±% | |
|---|---|---|---|---|---|
| Labour | Dave Ellison* | 2,813 | 40.0 | -4.2 | |
| Liberal Democrats | Simon Ashley | 2,003 | 28.5 | -2.2 | |
| Conservative | David Semple | 1,053 | 15.0 | +1.1 | |
| Green | Arnold James Spencer | 886 | 12.6 | +1.5 | |
| UKIP | Robert Gutfreund-Walmsley | 228 | 3.2 | N/A | |
| TUSC | Alex Longworth-Dunbar | 52 | 0.7 | N/A | |
| Majority | 810 | 11.5 | |||
| Turnout | 7,035 | 67.0 | +30.1 | ||
| Labour hold | Swing | ||||
May 2014
| Party | Candidate | Votes | % | ±% | |
|---|---|---|---|---|---|
| Labour | Josie Teubler | 1,457 | 46.27 | +14.12 | |
| Liberal Democrats | Mark Clayton | 1,295 | 41.12 | -9.07 | |
| Green | Glen Marsden | 592 | 15.82 | N/A | |
| Conservative | David Robert Semple | 397 | 12.61 | -5.05 | |
| Majority | 162 | 4.33 | |||
| Turnout | 3,741 | 36 | |||
| Labour gain from Liberal Democrats | Swing | ||||
May 2012
| Party | Candidate | Votes | % | ±% | |
|---|---|---|---|---|---|
| Labour | Carl Ollerhead | 1,393 | 47.5 | +24.7 | |
| Liberal Democrats | Graham Shaw* | 909 | 31.0 | -16.2 | |
| Green | Gareth Price-Thomas | 317 | 10.8 | +0.5 | |
| Conservative | Dola Miah | 246 | 8.4 | -8.2 | |
| Democracy First | Robert Gutfreund-Walmsley | 69 | 2.4 | N/A | |
| Majority | 484 | 16 | |||
| Turnout | 2934 | 27.9 | |||
| Labour gain from Liberal Democrats | Swing | ||||
May 2011
| Party | Candidate | Votes | % | ±% | |
|---|---|---|---|---|---|
| Labour | David Ellison | 1,686 | 44.2 | +19.7 | |
| Liberal Democrats | Craig Whittall | 1,172 | 30.7 | -15.0 | |
| Conservative | Jonathan Millard | 530 | 13.9 | -0.4 | |
| Green | James Alden | 424 | 11.1 | -2.3 | |
| Majority | 514 | 13.5 | |||
| Turnout | 3,812 | 36.9 | |||
| Labour gain from Liberal Democrats | Swing | ||||
May 2010
| Party | Candidate | Votes | % | ±% | |
|---|---|---|---|---|---|
| Liberal Democrats | Mark Clayton* | 3,088 | 50.2 | +3.0 | |
| Labour | David Clive Ellison | 1,978 | 32.2 | +9.4 | |
| Conservative | David Michael Bean | 1,086 | 17.7 | +1.1 | |
| Majority | 1,110 | 18.0 | -6.4 | ||
| Turnout | 6,152 | 61.4 | +33.6 | ||
| Liberal Democrats hold | Swing | -3.2 | |||
Elections in 2000s
| Party | Candidate | Votes | % | ±% | |
|---|---|---|---|---|---|
| Liberal Democrats | Graham Shaw* | 1,283 | 47.2 | +1.5 | |
| Labour | Jenny Lennox | 620 | 22.8 | -1.7 | |
| Conservative | David Bean | 451 | 16.6 | +2.3 | |
| Green | James Alden | 281 | 10.3 | -3.1 | |
| UKIP | Robert Gutfreund-Walmsley | 81 | 3.0 | +0.9 | |
| Majority | 663 | 24.4 | +3.2 | ||
| Turnout | 2,716 | 27.8 | -1.4 | ||
| Liberal Democrats hold | Swing | +1.6 | |||
| Party | Candidate | Votes | % | ±% | |
|---|---|---|---|---|---|
| Liberal Democrats | Neil Trafford* | 1,328 | 45.7 | +2.8 | |
| Labour | David Ellison | 712 | 24.5 | -0.5 | |
| Conservative | Peter Caddick | 414 | 14.3 | -3.2 | |
| Green | James Alden | 389 | 13.4 | +1.5 | |
| UKIP | Robert Gutfreund-Walmsley | 61 | 2.1 | -0.6 | |
| Majority | 616 | 21.2 | +3.3 | ||
| Turnout | 2,904 | 29.2 | +1.2 | ||
| Liberal Democrats hold | Swing | +1.6 | |||
| Party | Candidate | Votes | % | ±% | |
|---|---|---|---|---|---|
| Liberal Democrats | Richard Mark Clayton | 1,189 | 42.9 | +0.1 | |
| Labour | David Clive Ellison | 692 | 25.0 | +4.6 | |
| Conservative | Peter Girvan Hilton | 485 | 17.5 | +2.3 | |
| Green | George Stanislaw Czernuszka | 329 | 11.9 | -4.2 | |
| UKIP | Robert Gutfreund-Walmsley | 76 | 2.7 | -2.9 | |
| Majority | 497 | 17.9 | -4.5 | ||
| Turnout | 2,771 | 28.0 | -8.4 | ||
| Liberal Democrats hold | Swing | -2.2 | |||
| Party | Candidate | Votes | % | ±% | |
|---|---|---|---|---|---|
| Liberal Democrats | Graham Shaw | 1,565 | 42.8 | N/A | |
| Liberal Democrats | Neil Trafford* | 1,515 | |||
| Liberal Democrats | Simon Wheale* | 1,476 | |||
| Labour | Brendan Turner | 745 | 20.4 | N/A | |
| Labour | Emily Lomax | 706 | |||
| Labour | Peter Copping | 627 | |||
| Green | Richard Gee | 589 | 16.1 | N/A | |
| Green | Robina-Ella Davies | 578 | |||
| Conservative | Peter Hilton | 554 | 15.1 | N/A | |
| Conservative | Sean Ell | 503 | |||
| Conservative | Jonathan Smith | 466 | |||
| Green | Clifford Saffer | 443 | |||
| UKIP | Robert Gutfreund-Walmsley | 205 | 5.6 | N/A | |
| Majority | 731 | 22.4 | N/A | ||
| Turnout | 3,658 | 36.4 | N/A | ||
| Liberal Democrats win (new seat) | |||||
| Liberal Democrats win (new seat) | |||||
| Liberal Democrats win (new seat) | |||||
References
- 1 2 "Area: Didsbury West (Manchester Ward)". neighbourhood.statistics.gov.uk. Retrieved 28 April 2017.
- ↑ "Council wards in Manchester". manchester.gov.uk. Manchester City Council. Retrieved 28 April 2017.
- ↑ "Jeff Smith MP". parliament.uk. UK Parliament. Retrieved 28 April 2017.
- ↑ "Councillor Richard Kilpatrick". democracy.manchester.gov.uk. Manchester City Council. Retrieved 6 May 2023.
- ↑ "Councillor John Leech". democracy.manchester.gov.uk. Manchester City Council. Retrieved 7 August 2019.
- ↑ Ottewell, David (19 April 2009). "'Rising star' councillor killed". Manchester Evening News. Trinity Mirror. Retrieved 30 April 2017.
- ↑ "Didsbury West ward local by-election - Thursday 29 January 2009". manchester.gov.uk. Manchester City Council. 29 January 2009. Retrieved 30 April 2017.
- ↑ "3 May 2018 Local Government Election results". manchester.gov.uk. Manchester City Council. Archived from the original on 3 May 2019. Retrieved 2 May 2019.
- ↑ "3 May 2018 Local Government Election results". manchester.gov.uk. Manchester City Council. Archived from the original on 7 May 2018. Retrieved 5 May 2018.
- ↑ "Local election results - Thursday 5 May 2016". manchester.gov.uk. Manchester City Council. Retrieved 30 April 2017.
- ↑ "Local election results - Thursday 7 May 2015". manchester.gov.uk. Manchester City Council. Retrieved 30 April 2017.
- ↑ "Local election results 2014". manchester.gov.uk. Manchester City Council. Retrieved 30 April 2017.
- ↑ "Results of the Manchester City Council election, 2012". manchester.gov.uk. Manchester City Council. Retrieved 30 April 2017.
- ↑ "Local election results 2011". manchester.gov.uk. Manchester City Council. Retrieved 30 April 2017.
- ↑ "Election results: 6 May 2010". manchester.gov.uk. Manchester City Council. Retrieved 30 April 2017.
- ↑ "Local elections 2008". manchester.gov.uk. Manchester City Council. Retrieved 1 May 2017.
- ↑ "Local elections 2007". manchester.gov.uk. Manchester City Council. Retrieved 1 May 2017.
- ↑ "Local elections 2006". manchester.gov.uk. Manchester City Council. Retrieved 1 May 2017.
- ↑ "Local Elections 10 June 2004". manchester.gov.uk. Manchester City Council. Archived from the original on 26 June 2004. Retrieved 1 May 2017.
This article is issued from Wikipedia. The text is licensed under Creative Commons - Attribution - Sharealike. Additional terms may apply for the media files.