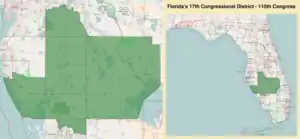
| Florida's 17th congressional district | |||
|---|---|---|---|
Interactive map of district boundaries since January 3, 2023 | |||
| Representative |
| ||
| Area | 6,315[1] sq mi (16,360 km2) | ||
| Distribution |
| ||
| Population (2022) | 839,779[3] | ||
| Median household income | $70,558[3] | ||
| Ethnicity |
| ||
| Cook PVI | R+10[4] | ||
Florida's 17th congressional district is an electoral district for the U.S. Congress, located in Southwest Florida. In the 2020 redistricting cycle, the district was shrunk to only include the coastal counties of Sarasota and Charlotte as well as northeastern Lee County, including most of Lehigh Acres. Other inland counties which were previously in the district were instead redistricted into the new 18th district.
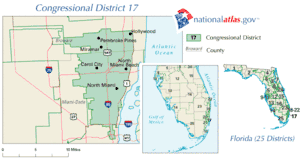
The 17th district was created as a result of the redistricting cycle after the 1980 census. From 2003 to 2013 it was located in South Florida, and was a majority African American district. It included the southern parts of Broward County and the eastern parts of Miami-Dade County. Included within the district were Pembroke Pines, Hollywood, Miramar, and North Miami. Most of this district is now the 24th district.
After the 2010 census and its corresponding redistricting cycle, the district included portions of the previous 12th and 16th districts. Most of the district's territory came from the western portion of the old 16th. After court-ordered redistricting for the 2016 elections, the district included a large area of central Florida from eastern Tampa Bay to the western shores of Lake Okeechobee, including all of Charlotte County, DeSoto County, Glades County, Hardee County, Highlands County and Okeechobee County, plus parts of Lee County, Polk County and Sarasota County. Major cities in the district included North Port, Punta Gorda, Venice, Wauchula, Arcadia, and Okeechobee.
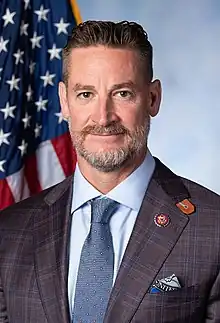
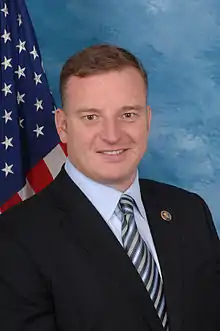
Republican Tom Rooney, incumbent congressman of the previous 16th district, ran for reelection in the 17th in 2012 and won. He was re-elected in 2014 and 2016, but did not run for re-election in 2018.[5][6] Greg Steube was elected on November 6.
Voting
| Year | Results |
|---|---|
| 1992 | Bill Clinton 74% – George H. W. Bush 18% – Ross Perot 7% |
| 1996 | Bill Clinton 85% – Bob Dole 12% |
| 2000 | Al Gore 84% – George W. Bush 15% |
| 2004 | John Kerry 83% – George W. Bush 17% |
| 2008 | Barack Obama 87% – John McCain 12% |
| 2012 | Mitt Romney 58% – Barack Obama 41% |
| 2016 | Donald Trump 62% – Hillary Clinton 35% |
| 2020 | Donald Trump 63% – Joe Biden 35% |
List of members representing the district
Election results
2002
| Party | Candidate | Votes | % | |
|---|---|---|---|---|
| Democratic | Kendrick Meek | 113,749 | 99.94% | |
| No party | Others | 73 | 0.06% | |
| Total votes | 113,822 | 100.00% | ||
| Turnout | ||||
| Democratic hold | ||||
2004
| Party | Candidate | Votes | % | |
|---|---|---|---|---|
| Democratic | Kendrick Meek (Incumbent) | 178,690 | 99.59% | |
| No party | Others | 734 | 0.41% | |
| Total votes | 179,424 | 100.00% | ||
| Turnout | ||||
| Democratic hold | ||||
2006
| Party | Candidate | Votes | % | |
|---|---|---|---|---|
| Democratic | Kendrick Meek (Incumbent) | 90,663 | 99.97% | |
| No party | Others | 23 | 0.03% | |
| Total votes | 90,686 | 100.00% | ||
| Turnout | ||||
| Democratic hold | ||||
2008
| Party | Candidate | Votes | % | |
|---|---|---|---|---|
| Democratic | Kendrick Meek (Incumbent) | 100.00% | ||
| Total votes | 100.00% | |||
| Turnout | ||||
| Democratic hold | ||||
2010
| Party | Candidate | Votes | % | |
|---|---|---|---|---|
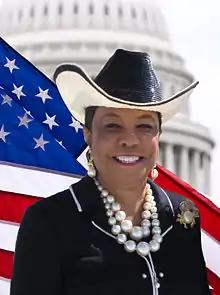
| Democratic | Frederica S. Wilson | 106,361 | 86.21% | |
| Independent | Roderick Vereen | 17,009 | 13.79% | |
| Total votes | 123,370 | 100.00% | ||
| Turnout | ||||
| Democratic hold | ||||
2012
| Party | Candidate | Votes | % | ||
|---|---|---|---|---|---|
| Republican | Tom Rooney (incumbent) | 165,488 | 58.6 | ||
| Democratic | William Bronson | 116,766 | 41.4 | ||
| Independent | Tom Baumann (write-in) | 12 | 0.0 | ||
| Total votes | 282,266 | 100.0 | |||
| Republican win (new seat) | |||||
2014
| Party | Candidate | Votes | % | |
|---|---|---|---|---|
| Republican | Tom Rooney (incumbent) | 141,493 | 63.2 | |
| Democratic | Will Bronson | 82,263 | 36.8 | |
| Total votes | 223,756 | 100.0 | ||
| Republican hold | ||||
2016
| Party | Candidate | Votes | % | |
|---|---|---|---|---|
| Republican | Tom Rooney (incumbent) | 209,348 | 61.8 | |
| Democratic | April Freeman | 115,974 | 34.2 | |
| Independent | John W Sawyer, III | 13,353 | 4.0 | |
| Total votes | 338,675 | 100.0 | ||
2018
| Party | Candidate | Votes | % | |
|---|---|---|---|---|
| Republican | Greg Steube | 193,326 | 62.3 | |
| Democratic | Allen Ellison | 117,194 | 37.7 | |
| Total votes | 310,520 | 100.0 | ||
| Republican hold | ||||
2020
| Party | Candidate | Votes | % | ||
|---|---|---|---|---|---|
| Republican | Greg Steube (incumbent) | 266,514 | 64.6% | ||
| Democratic | Allen Ellison | 140,487 | 34.1% | ||
| Independent | Theodore "Pink Tie" Murray | 5,396 | 1.3% | ||
| Total votes | 412,397 | 100.0 | |||
| Republican hold | |||||
2022
| Party | Candidate | Votes | % | ||
|---|---|---|---|---|---|
| Republican | Greg Steube (incumbent) | 222,601 | 63.8% | ||
| Democratic | Andrea Kale | 123,822 | 35.5% | ||
| Independent | Theodore Murray | 2,226 | 0.64% | ||
| Total votes | 348,649 | 100.0 | |||
| Republican hold | |||||
References
- ↑ "Congressional Plan--SC14-1905 (Ordered by The Florida Supreme Court, 2-December-2015)" (PDF). Florida Senate Committee on Reapportionment. Retrieved January 11, 2017.
- ↑ "Congressional Districts Relationship Files (State-based)". U.S. Census Bureau. Archived from the original on April 2, 2013.
- 1 2 Center for New Media & Promotion (CNMP), US Census Bureau. "My Congressional District". www.census.gov.
- ↑ "2022 Cook PVI: District Map and List". Cook Political Report. Retrieved January 10, 2023.
- ↑ Leary, Alex (February 19, 2018). "Rep. Tom Rooney will not seek re-election". Tampa Bay Times. Tampa, Fla. Retrieved February 19, 2018.
- ↑ Persons, Sally (February 19, 2018). "Rep. Tom Rooney will not seek re-election: Report". The Washington Times. Washington, D.C. Retrieved February 19, 2018.
- ↑ "November 5, 2002 General Election". Florida Division of Elections. Retrieved January 15, 2021.
- ↑ "November 2, 2004 General Election". Florida Division of Elections. Retrieved January 15, 2021.
- ↑ "November 7, 2006 General Election". Florida Division of Elections. Retrieved January 15, 2021.
- ↑ "November 4, 2008 General Election". Florida Division of Elections. Retrieved January 15, 2021.
- ↑ "November 2, 2010 General Election". Florida Division of Elections. Retrieved January 15, 2021.
- ↑ "November 6, 2012 General Election". Florida Division of Elections. Retrieved January 15, 2021.
- ↑ "November 4, 2014 General Election". Florida Division of Elections. Retrieved January 15, 2021.
- ↑ "November 8, 2016 General Election". Florida Division of Elections. Retrieved January 15, 2021.
- ↑ "November 6, 2018 General Election". Florida Division of Elections. Retrieved January 15, 2021.
- ↑ "November 3, 2020 General Election". Florida Division of Elections. Retrieved January 15, 2021.
External links
- Martis, Kenneth C. (1989). The Historical Atlas of Political Parties in the United States Congress. New York: Macmillan Publishing Company.
- Congressional Biographical Directory of the United States 1774–present
.svg.png.webp)

.tif.png.webp)
