Town of Franklin | |
|---|---|
| Franklin, Connecticut | |
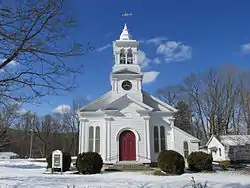
 Congregational Church | |
 Seal | |
  | |
| Coordinates: 41°37′11″N 72°08′33″W / 41.61972°N 72.14250°W | |
| Country | |
| U.S. state | |
| County | New London |
| Region | Southeastern CT |
| Incorporated | 1786 |
| Government | |
| • Type | Selectman-town meeting |
| • First selectman | Alden Miner |
| Area | |
| • Total | 19.6 sq mi (50.8 km2) |
| • Land | 19.5 sq mi (50.5 km2) |
| • Water | 0.1 sq mi (0.2 km2) |
| Elevation | 315 ft (96 m) |
| Population (2020) | |
| • Total | 1,863 |
| • Density | 95/sq mi (37/km2) |
| Time zone | UTC-5 (Eastern) |
| • Summer (DST) | UTC-4 (Eastern) |
| ZIP Code | 06254 |
| Area code(s) | 860/959 |
| FIPS code | 09-29910 |
| GNIS feature ID | 0213431 |
| Website | www |
Franklin is a town in New London County, Connecticut, United States. The town is part of the Southeastern Connecticut Planning Region. The population was 1,863 at the 2020 census.[1] The town includes the village of North Franklin.
History

Europeans first settled in what would become Franklin in 1663 as part of the larger division of the town of Norwich, Connecticut.[2] In 1716 the residents formed the Second Ecclesiastical Society of Norwich, also called the West Farms Society.[3][4] In 1758, West Farms was divided in half by the creation of the Eighth, or Pautipaug, Society of Norwich.[5]
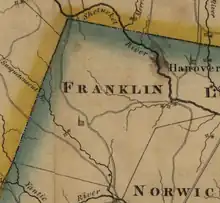
The West Farms and Pautipaug Societies were incorporated from Norwich as the Town of Franklin in 1786.[6][7][8] The town is named after Benjamin Franklin.[8] Until 1861 the town's borders extended east to the Shetucket River and included the early village of Baltic, Connecticut. That year, the town of Sprague, Connecticut was incorporated from the towns of Franklin and Lisbon, Connecticut which gave Franklin its present bounds.[9]
Geography
According to the United States Census Bureau, the town has a total area of 19.6 square miles (51 km2), of which 19.5 square miles (51 km2) is land and 0.1 square miles (0.26 km2), or 0.36%, is water.
Demographics
| Census | Pop. | Note | %± |
|---|---|---|---|
| 1820 | 1,161 | — | |
| 1850 | 895 | — | |
| 1860 | 2,358 | 163.5% | |
| 1870 | 731 | −69.0% | |
| 1880 | 686 | −6.2% | |
| 1890 | 585 | −14.7% | |
| 1900 | 546 | −6.7% | |
| 1910 | 527 | −3.5% | |
| 1920 | 552 | 4.7% | |
| 1930 | 611 | 10.7% | |
| 1940 | 667 | 9.2% | |
| 1950 | 727 | 9.0% | |
| 1960 | 974 | 34.0% | |
| 1970 | 1,356 | 39.2% | |
| 1980 | 1,592 | 17.4% | |
| 1990 | 1,810 | 13.7% | |
| 2000 | 1,835 | 1.4% | |
| 2010 | 1,922 | 4.7% | |
| 2020 | 1,863 | −3.1% | |
| U.S. Decennial Census[10] | |||
At the 2000 census there were 1,835 people, 687 households, and 528 families living in the town. The population density was 94.0 inhabitants per square mile (36.3/km2). There were 711 housing units at an average density of 36.4 per square mile (14.1/km2). The racial makeup of the town was 97.98% White, 0.71% African American, 0.05% Native American, 0.05% Asian, 0.05% Pacific Islander, 0.05% from other races, and 1.09% from two or more races. Hispanic or Latino of any race were 1.20%.[11]
Of the 687 households 33.8% had children under the age of 18 living with them, 66.7% were married couples living together, 6.1% had a female householder with no husband present, and 23.1% were non-families. 18.9% of households were one person and 8.7% were one person aged 65 or older. The average household size was 2.66 and the average family size was 3.04.
The age distribution was 24.1% under the age of 18, 5.9% from 18 to 24, 29.8% from 25 to 44, 27.4% from 45 to 64, and 12.8% 65 or older. The median age was 40 years. For every 100 females, there were 103.9 males. For every 100 females age 18 and over, there were 100.3 males.
The median household income was $62,083 and the median family income was $68,478. Males had a median income of $45,197 versus $31,492 for females. The per capita income for the town was $25,477. About 1.1% of families and 2.5% of the population were below the poverty line, including 2.3% of those under age 18 and 6.0% of those age 65 or over.
| Voter Registration and Party Enrollment as of October 25, 2005[12] | |||||
|---|---|---|---|---|---|
| Party | Active Voters | Inactive Voters | Total Voters | Percentage | |
| Democratic | 335 | 4 | 339 | 26.86% | |
| Republican | 319 | 2 | 321 | 25.44% | |
| Unaffiliated | 594 | 7 | 601 | 47.62% | |
| Minor Parties | 1 | 0 | 1 | 0.08% | |
| Total | 1,249 | 13 | 1,262 | 100% | |
| Presidential Election Results[13][14] | |||
|---|---|---|---|
| Year | Democratic | Republican | Third Parties |
| 2020 | 43.8% 553 | 53.4% 674 | 2.8% 34 |
| 2016 | 37.8% 413 | 56.1% 613 | 6.1% 67 |
| 2012 | 49.1% 519 | 48.9% 516 | 2.0% 20 |
| 2008 | 50.5% 538 | 47.3% 504 | 2.2% 22 |
| 2004 | 48.0% 513 | 50.5% 540 | 1.5% 15 |
| 2000 | 53.3% 534 | 41.9% 420 | 4.8% 48 |
| 1996 | 51.3% 493 | 34.0% 327 | 14.7% 141 |
| 1992 | 34.3% 386 | 35.6% 401 | 30.1% 339 |
| 1988 | 39.2% 396 | 59.1% 597 | 1.7% 16 |
| 1984 | 29.0% 302 | 70.1% 729 | 0.9% 8 |
| 1980 | 30.4% 272 | 59.3% 531 | 10.3% 92 |
| 1976 | 47.8% 380 | 51.9% 413 | 0.3% 2 |
| 1972 | 34.3% 252 | 65.2% 478 | 0.5% 3 |
| 1968 | 41.1% 249 | 51.9% 315 | 7.0% 42 |
| 1964 | 61.6% 328 | 38.4% 205 | 0.00% 0 |
| 1960 | 43.4% 239 | 56.6% 312 | 0.00% 0 |
| 1956 | 33.6% 165 | 66.4% 326 | 0.00% 0 |
Emergency services
Police
Due to the size of Franklin, there is no police department. Instead, the town has a partnership with the Connecticut State Police (Troop K) to provide coverage in case of an emergency.[15]
Fire Department
Franklin's volunteer fire department is led by Chief Mark Nall. The all-volunteer department provides fire, rescue, and emergency services to the town.[16]
Notable locations
- Ashbel Woodward House – built in 1835 and added to the National Register of Historic Places in 1992.
Notable people
- Lafayette S. Foster (1806–1880), United States senator and Connecticut Supreme Court judge; born in Franklin.
- Jacob Kingsbury (1756-1837), Army Officer during the American Revolutionary War, Northwest Indian War, and War of 1812.
- Orsamus H. Marshall (1813–1884), former Chancellor of University of Buffalo
- Uriah Tracy (1755–1807), patriot, congressman, U.S. senator, and first person interred in the Congressional Cemetery; born in Franklin.
- Ashbel Woodward (1804-1885), medical doctor, historian, and Regimental Surgeon of the 26th Connecticut Infantry Regiment Regiment during the American Civil War.
References
- ↑ "Census - Geography Profile: Franklin town, New London County, Connecticut". United States Census Bureau. Retrieved December 15, 2021.
- ↑ Woodward, Ashbel (1870). A Historical Address Delivered in Franklin, Connecticut, October 14th, 1868 on the Two Hundreth Anniversary of the Settlement of the Town and the One Hundred and Fiftieth Anniversary of its Ecclesiastical Organizations. New Haven, CT. Tuttle, Morehouse & Taylor. p. 15
- ↑ Woodward, Ashbel (1870). p. 25
- ↑ Caulkins, Frances Manwaring (1866). History of Norwich, Connecticut: From its Poessession by the Indians, to the year 1866. Hartford, CT: Case, Lockwood & Brainard. p. 429
- ↑ Caulkins, Frances Manwaring (1866). p. 432
- ↑ Woodward, Ashbel (1870). p 40
- ↑ Caulkins, Frances Manwaring (1866). p. 429-434
- 1 2 The Connecticut Magazine: An Illustrated Monthly. Connecticut Magazine Company. 1903. p. 332.
- ↑ Caulkins, Frances Manwaring (1866). p. 446
- ↑ "Census of Population and Housing". Census.gov. Retrieved June 4, 2015.
- ↑ "U.S. Census website". United States Census Bureau. Retrieved January 31, 2008.
- ↑ "Registration and Party Enrollment Statistics as of October 25, 2005" (PDF). Connecticut Secretary of State. Archived from the original (PDF) on September 23, 2006. Retrieved October 2, 2006.
- ↑ "General Election Statements of Vote, 1922 – Current". CT Secretary of State. Retrieved May 3, 2021.
- ↑ "Election Night Reporting". CT Secretary of State. Retrieved May 3, 2021.
- ↑ Veronica Rose, Chief Analyst. "Connecticut Police Department Statistics". Cga.ct.gov. Retrieved August 13, 2022.
- ↑ "Archived copy". Archived from the original on August 31, 2011. Retrieved April 13, 2012.
{{cite web}}: CS1 maint: archived copy as title (link)

