| 6th constituency of Gard | |
|---|---|
inline National Assembly of France | |
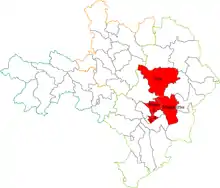
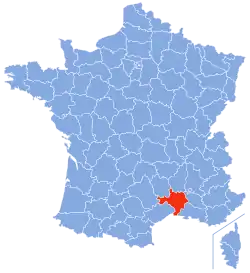
 Location of constituency in Department | |
 | |
| Deputy | |
| Department | Gard |
The 6th constituency of Gard is a French legislative constituency in the Gard département.
Deputies
| Election | Member | Party | |
|---|---|---|---|
| 2012 | Christophe Cavard | EELV | |
| 2017 | Philippe Berta | MoDem | |
| 2022 | |||
Election Results
2022
| Party | Candidate | Votes | % | ±% | |||
|---|---|---|---|---|---|---|---|
| EELV (NUPÉS) | Nicolas Cadene | 9,582 | 25.65 | +0.84 | |||
| MoDem (Ensemble) | Philippe Berta | 9,107 | 24.38 | -9.14 | |||
| RN | Laurence Gardet | 9,018 | 24.14 | +2.40 | |||
| LR (UDC) | François Courdil | 3,439 | 9.21 | -4.01 | |||
| REC | Stéphane Guillemin | 2,779 | 7.44 | N/A | |||
| FGR | Jean-Claude Maurin | 1,109 | 2.97 | N/A | |||
| Others | N/A | 2,318 | 6.21 | ||||
| Turnout | 37,352 | 45.01 | -1.39 | ||||
| 2nd round result | |||||||
| MoDem (Ensemble) | Philippe Berta | 16,921 | 52.17 | -8.18 | |||
| EELV (NUPÉS) | Nicolas Cadene | 15,514 | 47.83 | N/A | |||
| Turnout | 32,435 | 43.13 | +2.57 | ||||
| MoDem gain from LREM | |||||||
2017
| Candidate | Label | First round | Second round | |||
|---|---|---|---|---|---|---|
| Votes | % | Votes | % | |||
| Philippe Berta | REM | 12,397 | 33.52 | 17,879 | 60.35 | |
| Laurence Gardet | FN | 8,040 | 21.74 | 11,747 | 39.65 | |
| Karine Voinchet | FI | 4,910 | 13.28 | |||
| Richard Flandin | LR | 4,890 | 13.22 | |||
| Christophe Cavard | ECO | 2,990 | 8.08 | |||
| Philippe Gasser | PCF | 1,275 | 3.45 | |||
| Sibylle Jannekeyn | ECO | 823 | 2.23 | |||
| Jacques Armando | DLF | 666 | 1.80 | |||
| Jérémy Delapierre | DVD | 291 | 0.79 | |||
| Jean-Paul Elisseieff | ECO | 260 | 0.70 | |||
| Laurent Charpy | DIV | 259 | 0.70 | |||
| Aïcha Terbèche | EXG | 179 | 0.48 | |||
| Jean-Claude Boussouf | DVG | 4 | 0.01 | |||
| Votes | 36,984 | 100.00 | 29,626 | 100.00 | ||
| Valid votes | 36,984 | 98.22 | 29,626 | 89.99 | ||
| Blank votes | 497 | 1.32 | 2,325 | 7.06 | ||
| Null votes | 175 | 0.46 | 972 | 2.95 | ||
| Turnout | 37,656 | 46.40 | 32,923 | 40.56 | ||
| Abstentions | 43,499 | 53.60 | 48,253 | 59.44 | ||
| Registered voters | 81,155 | 81,176 | ||||
| Source: Ministry of the Interior[1] | ||||||
2012
| Candidate | Party | First round | Second round | ||||||||
|---|---|---|---|---|---|---|---|---|---|---|---|
| Votes | % | Votes | % | ||||||||
| Christophe Cavard | EELV–PS | 13,517 | 30.53% | 19,444 | 43.09% | ||||||
| Franck Proust | UMP | 11,804 | 26.66% | 14,366 | 31.84% | ||||||
| Sylvie Vignon | FN | 11,405 | 25.76% | 11,310 | 25.07% | ||||||
| Martine Gayraud | FG | 3,666 | 8.28% | ||||||||
| Philippe Berta | MoDem | 1,027 | 2.32% | ||||||||
| Silvain Pastor | EELV dissident | 576 | 1.30% | ||||||||
| Valérie Pezet | PRG | 521 | 1.18% | ||||||||
| Camille Benezech | DLR | 454 | 1.03% | ||||||||
| Mireille Ribanier | UDN | 364 | 0.82% | ||||||||
| Mélinda Ceccchinato | ?? | 355 | 0.80% | ||||||||
| Bruno Castel | NPA | 226 | 0.51% | ||||||||
| Aïcha Terbeche | LO | 125 | 0.28% | ||||||||
| Olivier Roudier | 118 | 0.27% | |||||||||
| Jeremiah Guiraud | AEI | 111 | 0.25% | ||||||||
| Valid votes | 44,269 | 98.76% | 45,120 | 98.41% | |||||||
| Spoilt and null votes | 554 | 1.24% | 729 | 1.59% | |||||||
| Votes cast / turnout | 44,823 | 57.72% | 45,849 | 59.05% | |||||||
| Abstentions | 32,829 | 42.28% | 31,793 | 40.95% | |||||||
| Registered voters | 77,652 | 100.00% | 77,642 | 100.00% | |||||||
References
- ↑ "Résultats des élections législatives 2017" [Results of 2017 Legislative Election] (in French). Ministry of the Interior.
- ↑ "Résultats des élections législatives 2012" [Results of 2012 Legislative Election] (in French). Ministry of the Interior.
This article is issued from Wikipedia. The text is licensed under Creative Commons - Attribution - Sharealike. Additional terms may apply for the media files.