Gloucestershire County Council in England is elected every four years. Since the last boundary changes in 2013 the council has comprised 53 councillors, each representing an electoral division. Elections are held every four years.[1]
Council elections
- 1973 Gloucestershire County Council election
- 1977 Gloucestershire County Council election
- 1981 Gloucestershire County Council election
- 1985 Gloucestershire County Council election
- 1989 Gloucestershire County Council election
- 1993 Gloucestershire County Council election
- 2001 Gloucestershire County Council election
- 2005 Gloucestershire County Council election
- 2009 Gloucestershire County Council election
- 2013 Gloucestershire County Council election
- 2017 Gloucestershire County Council election
- 2021 Gloucestershire County Council election
County result maps
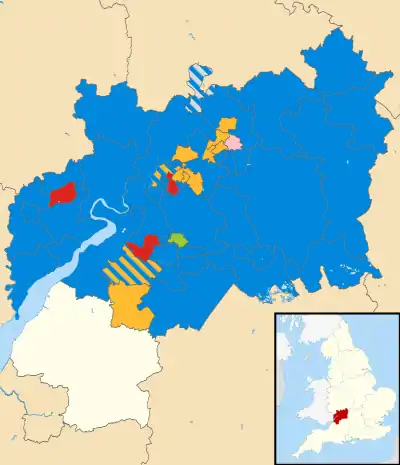
 2009 results map
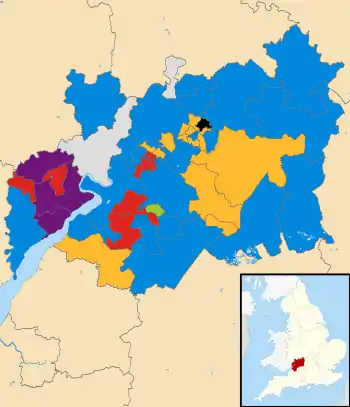
 2013 results map
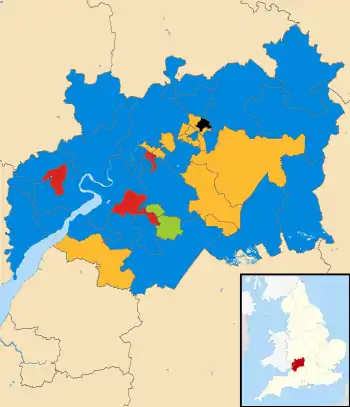
 2017 results map
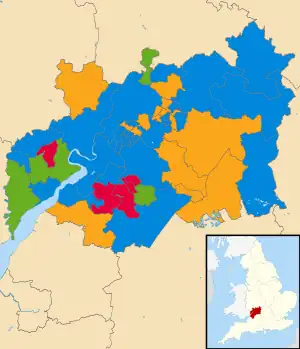
 2021 results map
By-election results
1993-1997
| Party | Candidate | Votes | % | ±% | |
|---|---|---|---|---|---|
| Liberal Democrats | 1,064 | 80.0 | |||
| Labour | 266 | 20.0 | |||
| Majority | 798 | 60.0 | |||
| Turnout | 1,370 | 16.0 | |||
| Liberal Democrats hold | Swing | ||||
1997-2001
| Party | Candidate | Votes | % | ±% | |
|---|---|---|---|---|---|
| Conservative | 1,274 | 44.0 | +9.1 | ||
| Liberal Democrats | 982 | 33.9 | +11.2 | ||
| Labour | 642 | 22.2 | -20.2 | ||
| Majority | 292 | 10.1 | |||
| Turnout | 2,898 | 24.0 | |||
| Conservative gain from Labour | Swing | ||||
| Party | Candidate | Votes | % | ±% | |
|---|---|---|---|---|---|
| Conservative | 1,087 | 60.8 | +13.6 | ||
| Liberal Democrats | 701 | 39.2 | -3.4 | ||
| Majority | 386 | 21.6 | |||
| Turnout | 1,788 | 37.9 | |||
| Conservative hold | Swing | ||||
| Party | Candidate | Votes | % | ±% | |
|---|---|---|---|---|---|
| Conservative | 1,230 | 71.8 | +31.3 | ||
| Liberal Democrats | 297 | 17.3 | -28.5 | ||
| Labour | 186 | 10.9 | -2.8 | ||
| Majority | 939 | 54.5 | |||
| Turnout | 1,713 | 26.2 | |||
| Conservative gain from Liberal Democrats | Swing | ||||
| Party | Candidate | Votes | % | ±% | |
|---|---|---|---|---|---|
| Liberal Democrats | 958 | 63.2 | -2.0 | ||
| Conservative | 416 | 27.5 | +5.8 | ||
| Labour | 141 | 9.3 | -3.9 | ||
| Majority | 542 | 35.7 | |||
| Turnout | 1,515 | 21.7 | |||
| Liberal Democrats hold | Swing | ||||
| Party | Candidate | Votes | % | ±% | |
|---|---|---|---|---|---|
| Liberal Democrats | 922 | 46.6 | |||
| Labour | 621 | 31.4 | |||
| Conservative | 437 | 22.1 | |||
| Majority | 301 | 15.2 | |||
| Turnout | 1,980 | 22.5 | |||
| Liberal Democrats gain from Labour | Swing | ||||
| Party | Candidate | Votes | % | ±% | |
|---|---|---|---|---|---|
| Conservative | 835 | 44.4 | +20.1 | ||
| Labour | 694 | 36.9 | +5.3 | ||
| Liberal Democrats | 350 | 18.6 | -25.5 | ||
| Majority | 141 | 7.5 | |||
| Turnout | 1,879 | 31.0 | |||
| Conservative gain from Liberal Democrats | Swing | ||||
2005-2009
| Party | Candidate | Votes | % | ±% | |
|---|---|---|---|---|---|
| Conservative | Antonia Noble | 2,208 | 52.3 | -6.6 | |
| Liberal Democrats | Martin Dunne | 1,605 | 38.0 | +7.3 | |
| Labour | Brian Hughes | 226 | 5.4 | +6.6 | |
| Green | Janet Thomas | 184 | 4.3 | +7.3 | |
| Majority | 603 | 14.3 | |||
| Turnout | 4,223 | 30.0 | |||
| Conservative hold | Swing | ||||
| Party | Candidate | Votes | % | ±% | |
|---|---|---|---|---|---|
| Liberal Democrats | Michael Collins | 1,040 | 52.9 | +41.0 | |
| Conservative | Ronald Furolo | 751 | 38.2 | +11. | |
| Labour | Terry Haines | 175 | 8.9 | -15.9 | |
| Majority | 289 | 14.7 | |||
| Turnout | 1,966 | 31.4 | |||
| Liberal Democrats gain from Independent | Swing | ||||
References
- ↑ "The Gloucestershire (Electoral Changes) Order 2012", legislation.gov.uk, The National Archives, SI 2012/877, retrieved 27 August 2023
- By-election results Archived 29 March 2010 at the Wayback Machine
External links
This article is issued from Wikipedia. The text is licensed under Creative Commons - Attribution - Sharealike. Additional terms may apply for the media files.