| Pennsylvania's 7th congressional district | |||
|---|---|---|---|
Interactive map of district boundaries since January 3, 2023 | |||
| Representative |
| ||
| Population (2022) | 774,340 | ||
| Median household income | $72,660 | ||
| Ethnicity |
| ||
| Cook PVI | R+2[1] | ||
Pennsylvania's 7th congressional district includes all of Carbon, Lehigh, and Northampton Counties; and parts of Monroe County. The district is represented by Democrat Susan Wild.
From March 2003 through 2018, the district incorporated parts of the Philadelphia suburbs, including most of Delaware County, along with portions of Chester, Montgomery, Berks, and Lancaster Counties. The district exhibited extreme non-congruity during that time as a result of gerrymandering.[2] On January 22, 2018, the Supreme Court of Pennsylvania ruled that the map violated the state constitution, and in February, it issued its own district boundaries for use in the 2018 elections and representation thereafter.[3] Most of the population in the old 7th district became part of a new 5th district, encompassing all of Delaware County and parts of South Philadelphia; while most of the old 15th district became the new 7th district.[4][5] In the 2020 redistricting cycle, Carbon County was added into the district, in exchange for the area around East Stroudsburg in Monroe County.
Pat Meehan, who had represented the old 7th district since 2011, resigned on April 27, 2018, amid a sexual harassment case. Mary Gay Scanlon won the special election on November 6, 2018, to replace him for the remainder of his term, and she served for slightly less than two months as the last representative for the old 7th district before being transferred to the newly redrawn 5th district. Susan Wild won the general election in the newly redrawn 7th district, and she took office January 3, 2019.
Recent statewide election results
The following table includes election results for previous incarnations of the 7th congressional district; see #Historical district boundaries.
| Year | Presidential | Representative | Notes |
|---|---|---|---|
| 2002 | – | Weldon 66.1–33.9% | New district boundaries |
| 2004 | Kerry 53–47% | Weldon 58.8–40.3% | |
| 2006 | – | Sestak 56.4–43.6% | |
| 2008 | Obama 56–43% | Sestak 59.6–40.4% | |
| 2010 | – | Meehan 54.9–44.1% | |
| 2012 | Romney 50.4–48.5% | Meehan 59.4–40.6% | |
| 2014 | – | Meehan 62.0–38.0% | New district boundaries |
| 2016 | Clinton 49.3–47.0% | Meehan 59.5–40.5% | |
| 2018 | – | Scanlon 52.3–46.0% | Special following Meehan's resignation |
| Wild 53.5–43.5% | New district boundaries | ||
| 2020 | Biden 51.8–47.0% | Wild 51.9–48.1% | |
| 2022 | – | Wild 51.0–49.0% | New district boundaries |
Geography
The 2003–2012 version of the district was located in southeastern Pennsylvania. It contained the western and northwestern suburbs of Philadelphia. It consisted of the majority of Delaware County (except for the City of Chester and some of the eastern boroughs), a portion of Chester County east of West Chester in the affluent Philadelphia Main Line area, and a portion of southern Montgomery County centered on Upper Merion Township.
The 2013–2018 version of the district contained most of Delaware County outside of the City of Chester and the heavily African American townships and boroughs in the eastern portion of the county. It also contained parts of central Montgomery County, southern portions of Berks County, southern and central portions of Chester County, and a small portion of eastern Lancaster County. The District as it stood in October 2016 was named on NPR's On the Media as an egregious example of gerrymandering. The shape of the district was described as "Goofy kicking Donald Duck. The only point that is essentially contiguous there is Goofy's foot in Donald Duck's rear end. ... However these district lines are the building blocks of democracy, and when they get as perverted and twisted as this, it leads to deeply undemocratic outcomes."[6] The Washington Post listed it as one of the ten most gerrymandered districts in the country.[7]
On February 19, 2018, the Supreme Court of Pennsylvania released a new congressional map after lawmakers had failed to agree on a map that would reduce gerrymandering. The map substantially redrew the District, relocating it to the Lehigh Valley.[5] The newly redrawn district includes all of Lehigh County and Northampton County as well as parts of Monroe County.
List of members representing the district
1791–1793: one seat
District created in 1791.
| Representative | Party | Years | Cong ress |
Electoral history |
|---|---|---|---|---|
| District first established March 4, 1791 | ||||
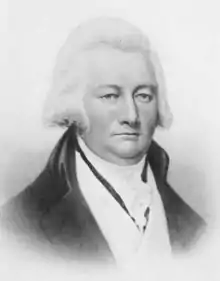 Thomas Hartley (York) |
Pro-Administration | March 4, 1791 – March 3, 1793 |
2nd | Redistricted from the at-large district and re-elected in 1791. Redistricted to the at-large district. |
District redistricted in 1793 to the at-large district.
1795–1823: one seat
District restored in 1795.
1823–1833: two seats
| Member | Party | Years | Cong ress |
Electoral history | Member | Party | Years | Cong ress |
Electoral history | |
|---|---|---|---|---|---|---|---|---|---|---|
| Henry Wilson (Allentown) |
Democratic-Republican[lower-alpha 1] | March 4, 1823 – March 3, 1825 |
18th | Elected in 1822. Re-elected in 1824. Died. |
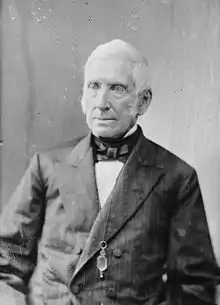
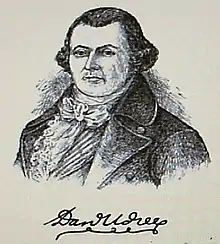 Daniel Udree (Reading) |
Democratic-Republican[lower-alpha 1] | March 4, 1823 – March 3, 1825 |
18th | Re-elected in 1822. Retired. | |
| Jacksonian | March 4, 1825 – August 24, 1826 |
19th | William Addams (Reading) |
Jacksonian | March 4, 1825 – March 3, 1829 |
19th 20th |
Elected in 1824. Re-elected in 1826. Lost re-election. | |||
| Vacant | August 24, 1826 – December 4, 1826 |
|||||||||
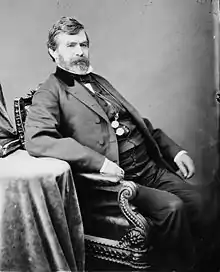
| Jacob Krebs (Orwigsburg) |
Jacksonian | December 4, 1826 – March 3, 1827 |
Elected October 10, 1826, to finish Wilson's term and seated December 4, 1826. Was not a candidate for the next term. | |||||||
| Joseph Fry Jr. (Fryburg) |
Jacksonian | March 4, 1827 – March 3, 1831 |
20th 21st |
Elected in 1826. Re-elected in 1828. Retired. | ||||||
.jpg.webp) Henry A. P. Muhlenberg (Reading) |
Jacksonian | March 4, 1829 – March 3, 1833 |
21st 22nd |
Elected in 1828. Re-elected in 1830. Redistricted to the 9th district. | ||||||
| Henry King (Allentown) |
Jacksonian | March 4, 1831 – March 3, 1833 |
22nd | Elected in 1830. Redistricted to the 8th district. | ||||||
1833–present: one seat
Historical district boundaries
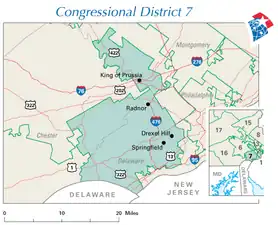 2003–2013
.tif.png.webp) 2013–2019
2013–2019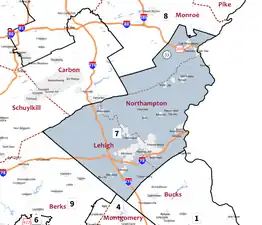 2019–2023
See also
Notes
- 1 2 Supported the Jackson faction in the 1824 United States presidential election.
References
- ↑ "2022 Cook PVI: District Map and List". Cook Political Report. Retrieved January 10, 2023.
- ↑ Ingraham, Christopher. "This is the best explanation of gerrymandering you will ever see". Washington Post. Retrieved January 21, 2023.
- ↑ League of Women Voters of Pennsylvania v. Commonwealth of Pennsylvania, No. 159 MM 2018, (PA February 19, 2018)
- ↑ "Pennsylvania Supreme Court strikes down state's congressional districts". CBS News. 2018 CBS Interactive Inc. CBS News. January 24, 2018. Retrieved January 24, 2018.
- 1 2 Cohn, Nate; Bloch, Matthew; Quealy, Kevin (February 19, 2018). "The New Pennsylvania House Districts Are In. We Review the Mapmakers' Choices". The Upshot. The New York Times. Retrieved February 20, 2018.
- ↑ "The System Is Rigged". On the Media. October 21, 2016.
- ↑ Ingraham, Christopher (May 15, 2014). "America's most gerrymandered congressional districts". The Washington Post. Retrieved December 17, 2021.
- ↑ "Sixteenth Congress March 4, 1819, to March 3, 1821". Office of the Historian, United States House of Representatives. Retrieved January 23, 2019 – via History.house.gov.
- Martis, Kenneth C. (1989). The Historical Atlas of Political Parties in the United States Congress. New York: Macmillan Publishing Company.
- Martis, Kenneth C. (1982). The Historical Atlas of United States Congressional Districts. New York: Macmillan Publishing Company.
.svg.png.webp)





.jpg.webp)


.jpg.webp)
.jpg.webp)

.jpg.webp)
.jpg.webp)


.jpg.webp)
.jpg.webp)


