| Guam's at-large congressional district | |||
|---|---|---|---|
 | |||
| Delegate |
| ||
| Area | 210 sq mi (540 km2) | ||
| Population (2020) | 153,836 | ||
| Median household income | 34,598 | ||
| Ethnicity |
| ||
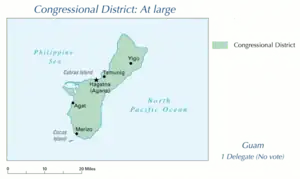
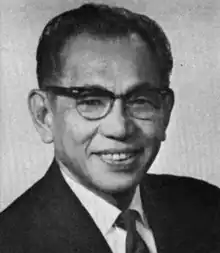
Guam's at-large congressional district comprises the entire area of the United States territory of Guam. Guam has been represented in the United States House of Representatives by a non-voting delegate since 1972.[1] Its first delegate, Antonio Borja Won Pat, had been serving as the Washington Representative lobbying for a delegate since 1965, elected for four-year terms in 1964 and 1968.[2] It is currently represented by Republican James Moylan who has represented the district since 2023.
List of delegates representing the district
| Representative | Party | Term | Cong ress |
Electoral history |
|---|---|---|---|---|
| District established February 12, 1970 | ||||
| Vacant | February 12, 1970 – January 3, 1973 |
91st 92nd |
||
 Antonio B. Won Pat |
Democratic | January 3, 1973 – January 3, 1985 |
93rd 94th 95th 96th 97th 98th |
Elected in 1972. Re-elected in 1974. Re-elected in 1976. Re-elected in 1978. Re-elected in 1980. Re-elected in 1982. Lost re-election. |
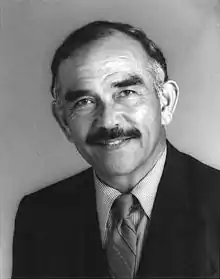
 Vicente T. Blaz |
Republican | January 3, 1985 – January 3, 1993 |
99th 100th 101st 102nd |
Elected in 1984. Re-elected in 1986. Re-elected in 1988. Re-elected in 1990. Lost re-election. |
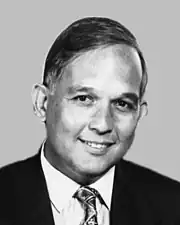
 Robert A. Underwood |
Democratic | January 3, 1993 – January 3, 2003 |
103rd 104th 105th 106th 107th |
Elected in 1992. Re-elected in 1994. Re-elected in 1996. Re-elected in 1998. Re-elected in 2000. Retired to run for Governor. |
 Madeleine Z. Bordallo |
Democratic | January 3, 2003 – January 3, 2019 |
108th 109th 110th 111th 112th 113th 114th 115th |
Elected in 2002. Re-elected in 2004. Re-elected in 2006. Re-elected in 2008. Re-elected in 2010. Re-elected in 2012. Re-elected in 2014. Re-elected in 2016. Lost renomination.[3][4] |
 Michael San Nicolas |
Democratic | January 3, 2019 – January 3, 2023 |
116th 117th |
Elected in 2018.[3][5] Re-elected in 2020. Retired to run for Governor. |
.jpg.webp) James Moylan |
Republican | January 3, 2023– present |
118th | Elected in 2022. |
Recent election results
1972
| Party | Candidate | Votes | % | ||
|---|---|---|---|---|---|
| Democratic | Antonio Borja Won Pat | 12,651 | 58.8% | ||
| Republican | Pedro Perez | 8,847 | 41.1% | ||
| Independent | Write-in | 15 | 0.1% | ||
| Total votes | 21,513 | 100.00% | |||
| Democratic gain from Vacancy | |||||
1974
| Party | Candidate | Votes | % | |
|---|---|---|---|---|
| Democratic | Antonio Borja Won Pat (Incumbent) | 18,551 | 100.00% | |
| Total votes | 18,551 | 100.00% | ||
| Democratic hold | ||||
1976
| Party | Candidate | Votes | % | |
|---|---|---|---|---|
| Democratic | Antonio Borja Won Pat (Incumbent) | 19,038 | 90.2% | |
| Independent | Write-in | 2,077 | 9.8% | |
| Total votes | 21,115 | 100.00% | ||
| Democratic hold | ||||
1978
| Party | Candidate | Votes | % | |
|---|---|---|---|---|
| Democratic | Antonio Borja Won Pat (Incumbent) | 21,123 | 91.0% | |
| Independent | Write-in | 2,088 | 9.0% | |
| Total votes | 23,211 | 100.00% | ||
| Democratic hold | ||||
1980
| Party | Candidate | Votes | % | |
|---|---|---|---|---|
| Democratic | Antonio Borja Won Pat (Incumbent) | 14,834 | 58.3% | |
| Republican | Antonio M. Palomo | 10,622 | 41.7% | |
| Total votes | 25,456 | 100.00% | ||
| Democratic hold | ||||
1982
| Party | Candidate | Votes | % | |
|---|---|---|---|---|
| Democratic | Antonio Borja Won Pat (Incumbent) | 15,627 | 51.7% | |
| Republican | Vincente Thomas "Ben" Blaz | 14,579 | 48.3% | |
| Total votes | 30,206 | 100.00% | ||
| Democratic hold | ||||
1984
| Party | Candidate | Votes | % | ||
|---|---|---|---|---|---|
| Republican | Ben Garrido Blaz | 15,839 | 50.3% | ||
| Democratic | Antonio Borja Won Pat (Incumbent) | 15,485 | 49.2% | ||
| Independent | Other | 144 | 0.5% | ||
| Total votes | 31,468 | 100.00% | |||
| Republican gain from Democratic | |||||
1986
| Party | Candidate | Votes | % | |
|---|---|---|---|---|
| Republican | Ben Garrido Blaz (Incumbent) | 22,207 | 64.6% | |
| Democratic | Frank C. Torres Jr. | 12,147 | 35.4% | |
| Total votes | 34,354 | 100.00% | ||
| Republican hold | ||||
1988
| Party | Candidate | Votes | % | |
|---|---|---|---|---|
| Republican | Ben Garrido Blaz (Incumbent) | 16,185 | 54.7% | |
| Democratic | Vincent C. Pangelinan | 13,426 | 45.3% | |
| Total votes | 29,611 | 100.00% | ||
| Republican hold | ||||
1990
| Party | Candidate | Votes | % | |
|---|---|---|---|---|
| Republican | Ben Garrido Blaz (Incumbent) | 21,390 | 55.1% | |
| Democratic | Vincent C. Pangelinan | 16,437 | 42.4% | |
| Independent | Other | 976 | 2.5% | |
| Total votes | 38,803 | 100.00% | ||
| Republican hold | ||||
1992
| Party | Candidate | Votes | % | ||
|---|---|---|---|---|---|
| Democratic | Robert A. Underwood | 18,462 | 55.3% | ||
| Republican | Ben Garrido Blaz (Incumbent) | 14,921 | 44.7% | ||
| Total votes | 33,383 | 100.00% | |||
| Democratic gain from Republican | |||||
1994
| Party | Candidate | Votes | % | |
|---|---|---|---|---|
| Democratic | Robert A. Underwood (Incumbent) | 36,379 | 100.00% | |
| Total votes | 36,379 | 100.00% | ||
| Democratic hold | ||||
1996
| Party | Candidate | Votes | % | |
|---|---|---|---|---|
| Democratic | Robert A. Underwood (Incumbent) | 34,395 | 100.00% | |
| Total votes | 34,395 | 100.00% | ||
| Democratic hold | ||||
1998
| Party | Candidate | Votes | % | |
|---|---|---|---|---|
| Democratic | Robert A. Underwood (Incumbent) | 34,179 | 76.1% | |
| Republican | Manuel Q. Cruz | 10,763 | 23.9% | |
| Total votes | 44,942 | 100.00% | ||
| Democratic hold | ||||
2000
| Party | Candidate | Votes | % | |
|---|---|---|---|---|
| Democratic | Robert A. Underwood (Incumbent) | 29,099 | 78.1% | |
| Republican | Manuel Cruz | 8,167 | 21.9% | |
| Total votes | 37,266 | 100.00% | ||
| Democratic hold | ||||
2002
| Party | Candidate | Votes | % | |
|---|---|---|---|---|
| Democratic | Madeleine Bordallo | 27,081 | 63.6% | |
| Republican | Joseph F. Ada | 14,836 | 34.9% | |
| Independent | Write-in | 662 | 1.5% | |
| Total votes | 42,579 | 100.00% | ||
| Democratic hold | ||||
2004
| Party | Candidate | Votes | % | |
|---|---|---|---|---|
| Democratic | Madeleine Bordallo (Incumbent) | 31,051 | 97.4% | |
| Independent | Write-in | 837 | 2.6% | |
| Total votes | 31,888 | 100.00% | ||
| Democratic hold | ||||
2006
| Party | Candidate | Votes | % | |
|---|---|---|---|---|
| Democratic | Madeleine Bordallo (Incumbent) | 32,677 | 96.5% | |
| Independent | Write-in | 1,201 | 3.5% | |
| Total votes | 33,878 | 100.00% | ||
| Democratic hold | ||||
2008
| Party | Candidate | Votes | % | |
|---|---|---|---|---|
| Democratic | Madeleine Bordallo (Incumbent) | 28,247 | 94.6% | |
| Independent | Write-in | 1,617 | 5.4% | |
| Total votes | 29,864 | 100.00% | ||
| Democratic hold | ||||
2010
| Party | Candidate | Votes | % | |
|---|---|---|---|---|
| Democratic | Madeleine Bordallo (Incumbent) | 35,919 | 95.9% | |
| Republican | Write-in | 796 | 2.1% | |
| Democratic | Write-in | 706 | 1.9% | |
| Total votes | 37,421 | 100.00% | ||
| Democratic hold | ||||
2012
| Party | Candidate | Votes | % | |
|---|---|---|---|---|
| Democratic | Madeleine Bordallo (incumbent) | 20,174 | 60.5 | |
| Republican | Frank F. Blas Jr. | 13,160 | 39.5 | |
| Total votes | 33,334 | 100 | ||
| Democratic hold | ||||
2014
| Party | Candidate | Votes | % | ±% | |
|---|---|---|---|---|---|
| Democratic | Madeleine Bordallo (incumbent) | 20,693 | 57.86% | -2.64% | |
| Republican | Margaret Metcalfe | 14,956 | 41.82% | +2.32% | |
| n/a | Write-ins | 113 | 0.32% | N/A | |
| Total votes | 35,762 | '100.0%' | N/A | ||
| Democratic hold | |||||
2016
| Party | Candidate | Votes | % | ±% | |
|---|---|---|---|---|---|
| Democratic | Madeleine Bordallo (incumbent) | 18,345 | 53.69% | -4.17% | |
| Republican | Felix Perez Camacho | 15,617 | 45.71% | +3.83% | |
| n/a | Write-ins | 206 | 0.60% | +0.28% | |
| Total votes | '34,168' | '100.0%' | N/A | ||
| Democratic hold | |||||
2018
| Party | Candidate | Votes | % | ±% | |
|---|---|---|---|---|---|
| Democratic | Michael San Nicolas | 19,193 | 54.85% | +1.16% | |
| Republican | Doris Flores-Brooks | 15,398 | 44.01% | -1.70% | |
| Write-in | 399 | 1.14% | +0.54% | ||
| Total votes | 34,990 | 100.00% | N/A | ||
| Democratic hold | |||||
2020
| Party | Candidate | Votes | % | |
|---|---|---|---|---|
| Democratic | Michael San Nicolas (incumbent) | 13,000 | 45.95 | |
| Democratic | Robert A. Underwood | 9,300 | 32.87 | |
| Republican | Wil Castro | 5,942 | 21.00 | |
| Write-in | 51 | 0.18 | ||
| Total votes | 28,293 | 100.00 | ||
| Party | Candidate | Votes | % | |
|---|---|---|---|---|
| Democratic | Michael San Nicolas (incumbent) | 10,467 | 59.62 | |
| Democratic | Robert A. Underwood | 7,090 | 40.38 | |
| — | Overvotes | 5 | .03 | |
| — | Undervotes | 28 | .16 | |
| Total votes | 17,355 | 100.00 | ||
2022
| Party | Candidate | Votes | % | ±% | |
|---|---|---|---|---|---|
| Republican | James Moylan | 17,075 | 52.19% | +31.19% | |
| Democratic | Judith Won Pat | 15,427 | 47.15% | -31.67% | |
| Write-in | 217 | 0.66% | +0.48% | ||
| Total votes | 32,719 | 100.0% | |||
| Republican gain from Democratic | |||||
References
- ↑ Guam v. Guerrero 290 F.3d 1210, 1214 fn. 5 (2002 9th Cir.) (citing 48 U.S.C. § 1711)
- ↑ "Bioguide Search".
- 1 2 "2018 Primary Election Results". Guam Election Commission. August 26, 2018.
- ↑ Garcia, Eric (August 27, 2018). "Guam Delegate Leaving Congress After Primary Loss". Roll Call. Archived from the original on August 27, 2018. Retrieved August 28, 2018.
- ↑ Congressman Gregorio Kilili Camacho Sablan. Kilili congratulates Michael San Nicolas, new Democratic Guam Delegate, November 6, 2018.
- 1 2 3 4 5 6 7 8 9 10 11 12 13 14 15 16 17 18 19 20 "Election Statistics, 1920 to Present | US House of Representatives: History, Art & Archives". History.house.gov. September 11, 2001. Retrieved January 21, 2020.
- ↑ Taitano, Zita (November 8, 2012). "Guam Democrats to maintain majority in Legislature". Marianas Variety. Retrieved November 15, 2012.
- ↑ "ELECTION UPDATE: 58 of 58 precincts reporting". Pacific Daily News. November 7, 2012. Retrieved November 15, 2012.
- ↑ "United States House of Representatives election in Guam, 2014". Ballotpedia.
- ↑ "GUAM OFFICIAL RESULTS GENERAL ELECTION NOVEMBER 8, 2016". Guam Election Commission.
- ↑ "GUAM OFFICIAL RESULTS GENERAL ELECTION NOVEMBER 6, 2018". Guam Election Commission.
- ↑ "Summary Results Report" (PDF). November 4, 2020.
- ↑ "Summary Runoff Results Report" (PDF). Retrieved January 6, 2023.
- ↑ "2022 General Election: Unofficial Results". Guam Election Commission.
This article is issued from Wikipedia. The text is licensed under Creative Commons - Attribution - Sharealike. Additional terms may apply for the media files.
