This is a list of the states and union territories of India ranked in order of number of children born for each woman.
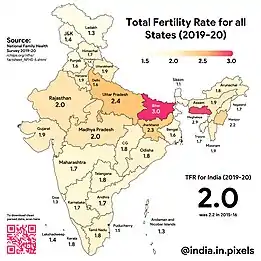
Recent surveys show that in majority of Indian states, fertility rate has fallen well below the replacement level of 2.1 and the country is fast approaching the replacement level itself.[1] The total fertility rate of India in 2017 stood at 2.2.[2] Due to the large population, poverty and strain on resources, the Indian government initiated population control efforts to decrease birth rate with the current target being at 2.1 children per woman.[3] According to data from National Family Health Survey-5, India's total fertility rate dropped below the replacement level of 2.1, and currently stands at 2.0.[4]
List
| No. | State/UT | Fertility Rate (Urban) | Fertility Rate (Rural) | Total Fertility Rate |
|---|---|---|---|---|
| 1 | Andhra Pradesh | 1.5 | 1.8 | 1.7 |
| 2 | Arunachal Pradesh | 1.4 | 1.9 | 1.8 |
| 3 | Assam | 1.5 | 1.9 | 1.9 |
| 4 | Bihar | 2.4 | 3.1 | 3.0 |
| 5 | Chhattisgarh | 1.4 | 1.9 | 1.8 |
| 6 | Goa | 1.3 | 1.4 | 1.3 |
| 7 | Gujarat | 1.7 | 2.0 | 1.9 |
| 8 | Haryana | 1.7 | 2.0 | 1.9 |
| 9 | Himachal Pradesh | 1.4 | 1.7 | 1.7 |
| * | 1.6 | 2.1 | 2.0 | |
| 10 | Jharkhand | 1.6 | 2.5 | 2.3 |
| 11 | Karnataka | 1.5 | 1.8 | 1.7 |
| 12 | Kerala | 1.8 | 1.8 | 1.8 |
| 13 | Madhya Pradesh | 1.8 | 2.1 | 2.0 |
| 14 | Maharashtra | 1.5 | 1.9 | 1.7 |
| 15 | Manipur | 1.8 | 2.4 | 2.2 |
| 16 | Meghalaya | 1.6 | 3.3 | 2.9 |
| 17 | Mizoram | 1.6 | 2.2 | 1.9 |
| 18 | Nagaland | 1.2 | 2.0 | 1.7 |
| 19 | Odisha | 1.5 | 1.9 | 1.8 |
| 20 | Punjab | 1.6 | 1.7 | 1.6 |
| 21 | Rajasthan | 1.7 | 2.1 | 2.0 |
| 22 | Sikkim | 0.7 | 1.3 | 1.1 |
| 23 | Tamil Nadu | 1.6 | 1.9 | 1.8 |
| 24 | Telangana | 1.8 | 1.7 | 1.8 |
| 25 | Tripura | 1.4 | 1.8 | 1.7 |
| 26 | Uttar Pradesh | 1.9 | 2.5 | 2.4 |
| 27 | Uttarakhand | 1.8 | 1.9 | 1.9 |
| 28 | West Bengal | 1.4 | 1.7 | 1.6 |
| 29 | Andaman & Nicobar Islands (UT) | 1.4 | 1.2 | 1.3 |
| 30 | Chandigarh (UT) | 1.4 | - | 1.4 |
| 31 | Dadra & Nagar Haveli and Daman & Diu (UT) | 1.7 | 1.9 | 1.8 |
| 32 | NCT Delhi | 1.6 | 2.5 | 1.6 |
| 33 | Jammu & Kashmir (UT) | 1.2 | 1.5 | 1.4 |
| 34 | Ladakh (UT) | 1.4 | 1.3 | 1.3 |
| 35 | Lakshadweep (UT) | 1.4 | 1.5 | 1.4 |
| 36 | Puducherry (UT) | 1.6 | 1.2 | 1.5 |
Total Fertility rate yearwise
| Rank | State/UT | Fertility rate 2021 | Fertility rate 1981[2] | Fertility rate 1991[2] | Fertility rate 1999[6] | Fertility rate 2009 [2] | Fertility rate 2017[7] | Fertility rate 2020 [8] | Change (1981–99) | Change (1999-16) | |
|---|---|---|---|---|---|---|---|---|---|---|---|
| 1 | Sikkim | 1.1 | - | - | 2.5 | 2.1 | 1.2 | 1.1 | |||
| 2 | Jammu and Kashmir | 1.4 | 4.5 | - | - | 2.53 | 1.6 | 1.4 | |||
| 3 | West Bengal | 1.6 | 4.2 | 3.2 | 2.4 | 1.9 | 1.8 | 1.6 | |||
| 4 | Delhi | 1.6 | - | 2.1 | 1.6 | 1.9 | 1.57 | 1.6 | |||
| 5 | Punjab | 1.6 | 4.6 | 3.1 | 2.5 | 1.9 | 1.7 | 1.5 | |||
| 6 | Andhra Pradesh | 1.7 | 4.0* | 3.0* | 2.4* | 1.8* | 1.8 | 1.7 | |||
| 7 | Himachal Pradesh | 1.7 | 3.8 | 3.1 | 2.4 | 2.0 | 1.9 | 1.7 | |||
| 8 | Karnataka | 1.7 | 3.6 | 3.1 | 2.5 | 1.9 | 1.7 | 1.7 | |||
| 9 | Maharashtra | 1.7 | 3.6 | 3.0 | 2.7 | 1.9 | 1.7 | 1.7 | |||
| 10 | Kerala | 1.8 | 2.4 | 2.0 | 1.8 | 1.8 | 1.6 | 1.8 | |||
| 11 | Telangana | 1.8 | 4.0* | 3.0* | 2.4* | 1.8* | 1.7 | 1.7 | |||
| 12 | Chhattisgarh | 1.8 | - | - | 3.7 | 3.0 | 2.4 | 2.4 | |||
| 13 | Odisha | 1.8 | 4.3 | 3.3 | 2.7 | 2.4 | 1.9 | 1.9 | |||
| 14 | Tamil Nadu | 1.8 | 3.4 | 2.2 | 2.0 | 1.7 | 1.6 | 1.6 | |||
| 15 | Assam | 1.9 | 4.1 | 3.5 | 3.2 | 2.6 | 2.3 | 1.9 | |||
| 16 | Gujarat | 1.9 | 4.3 | 3.1 | 3.0 | 2.5 | 2.2 | 1.9 | |||
| 17 | Haryana | 1.9 | 5.0 | 4.0 | 3.2 | 2.5 | 2.2 | 2.1 | |||
| 18 | Uttarakhand | 1.9 | - | - | - | 2.6 | 1.9 | 1.8 | |||
| 19 | Madhya Pradesh | 2.0 | 5.2 | 4.6 | 3.9 | 3.3 | 2.7 | 2.6 | |||
| 20 | Rajasthan | 2.0 | 5.2 | 4.6 | 4.2 | 3.3 | 2.7 | 2.4 | |||
| – | 2.0 | 4.5 | 3.8 | 3.2 | 2.6 | 2.2 | 2.0 | | | ||
| 21 | Jharkhand | 2.3 | - | - | 3.7 | 3.2 | 2.5 | 2.5 | |||
| 22 | Uttar Pradesh | 2.4 | 5.8 | 5.1 | 4.7 | 3.7 | 2.7 | 2.4 | |||
| 23 | Bihar | 3.0 | 5.7 | 4.4 | 4.5 | 3.9 | 3.2 | 3.0 | |||
| 24 | Meghalaya | - | - | - | - | 3.1 | 2.9 | 2.9 | |||
| 25 | Goa | 1.3 | 1.1 | 1.0 | 1.6 | 1.8 | 1.3 | ||||
| 26 | Tripura | - | - | - | 3.9 | 1.7 | 1.7 | 1.7 | |||
| 27 | Nagaland | - | - | - | 1.5 | 2.0 | 2.5 | 1.7 | |||
| 28 | Mizoram | - | - | - | - | 2.0 | 2.3 | 1.9 | |||
| 29 | Arunachal Pradesh | - | - | - | - | 2.7 | 2.1 | 1.7 | |||
| 30 | Manipur | - | - | - | 2.4 | 1.5 | 1.4 | 2.2 | |||
| – | Union Territories | - | - | - | - | - | - | - | |||
| 1 | Andaman & Nicobar | - | - | - | 1.9 | 1.5 | 1.5 | 1.3 | |||
| 2 | Lakshadweep | - | 6.3 | 4.8 | 3.8 | 2.6 | 1.9 | 1.4 | 0.2 | ||
| 3 | Chandigarh | - | - | - | - | 1.8 | 1.8 | 1.6 | |||
| 4 | Puduchery | - | - | - | 1.8 | 1.6 | 1.6 | 1.6 | |||
| 5 | Daman & Diu | - | - | - | 2.5 | 1.9 | 1.7 | 1.8 | |||
| 6 | Ladakh | - | - | - | - | - | - | 1.3 | - | ||
| 7 | Dadra Nagar Haveli | - | - | - | 3.5 | 3.3 | 2.3 | 1.8 | |||
Country comparisons use data from the Population Reference Bureau.
Visualisation
Google Chart TFR vs Area vs Population
Notes
- ↑ "Three states hold the key". The Indian Express. 15 July 2016. Retrieved 1 June 2017.
- 1 2 3 4 Table in Fourth National Family Health Survey of TFR, Department of Health and Family Welfare, Ministry of Health and Family Welfare, Government of India
- ↑ "What works for India's Family Planning Programme". Hindustan Times. 2020-02-21. Retrieved 2021-09-12.
- ↑ "India's fertility rate drops below 2.1, contraceptive prevalence up: NFHS". Hindustan Times. 2021-11-24. Retrieved 2021-11-24.
- ↑ "National Family Health Survey (NFHS-5)". rchiips.org. Retrieved 2021-11-25.
- ↑ Table in SRS Report (1999), Census Commission of India
- ↑ Table in
- ↑ Table in