Lindi Region
Mkoa wa Lindi (Swahili) | |
|---|---|
   | |
| Nickname: The Heritage Region | |
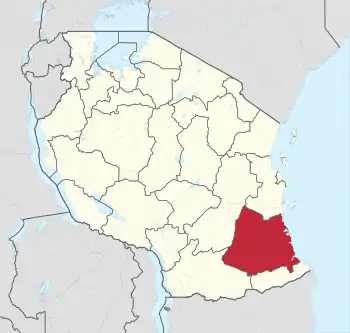
 Location in Tanzania | |
| Coordinates: 9°59′15.36″S 39°41′53.52″E / 9.9876000°S 39.6982000°E | |
| Country | |
| Zone | Coastal |
| Region | 1 July 1971 [1] |
| Named for | Lindi |
| Capital | Lindi Town |
| Districts | |
| Area | |
| • Total | 66,040 km2 (25,500 sq mi) |
| • Rank | 3rd of 31 |
| Highest elevation (Kongowele) | 830 m (2,720 ft) |
| Population (2012) | |
| • Total | 864,652 |
| • Rank | 24th of 31 |
| • Density | 13/km2 (34/sq mi) |
| Demonym | Lindian |
| Ethnic groups | |
| • Settler | Swahili |
| • Native | Matumbi, Mwera, Ngindo, Machinga & Makonde |
| Time zone | UTC+3 (EAT) |
| Postcode | 65xxx |
| Area code | 023 |
| ISO 3166 code | TZ-12 [2] |
| HDI (2021) | 0.509[3] low · 20th of 25 |
| Website | Official website |
| Symbols of Tanzania | |
| Bird |  |
| Butterfly | |
| Fish | |
| Mammal | |
| Tree |  |
| Mineral |  |
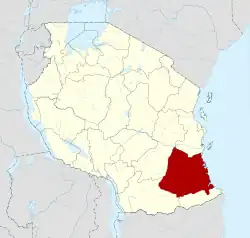
Lindi Region (Mkoa wa Lindi in Swahili) is one of Tanzania's 31 administrative regions. The region covers an area of 66,040 km2 (25,500 sq mi).[4] The region is comparable in size to the combined land area of the nation state of Sri Lanka.[5] The regional capital is the municipality of Lindi.
The Lindi Region borders on Pwani Region, Morogoro Region, Ruvuma Region, and Mtwara Region. The name Lindi is an old Swahili word meaning "hiding pits", a place where Swahili people will hide to defend themselves from hostile invasions.[6] The region is home to two UNESCO World Heritage Sites, namely; Kilwa Kisiwani and Selous Game Reserve. According to the 2012 national census, the region had a population of 864,652, which was lower than the pre-census projection of 960,236.[7]: page 2 For 2002–2012, the region's 0.9 percent average annual population growth rate was the 29th highest in the country.[7]: page 4 It was also the least densely populated region with 13 people per square kilometer.[7]: page 6
Geography
Geology and terrain
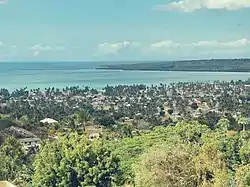
Lindi Region is the third largest region in Tanzania with a total area of 66,040 km2 (25,500 sq mi), after Morogoro Region at 70,624 km2 (27,268 sq mi). Lindi 's size is around 7.1% of the entire Tanzanian territory.[8] In comparison, Lindi is larger than the island nation of Sri Lanka which has a total land area of 62,732 square kilometers. Lindi Bay, located in the region, is one of the largest bays in the country. The highest peak in Lindi Region, Kongowele (830m) is located in Nachingwea District.[9] Lindi has 23 islands in its territory with the largest being Songo Mnara Island, followed by Kilwa Kisiwani Island and Songo Songo Island.
Climate
Lindi Region has a tropical savanna climate with a Köppen climate classification of 49 and Aw. Lindi Eegion receives annual precipitation level of 750 to 1200 millimeters, often raining in February and March during the wet season. The average temperature is lower at Nachingwea with a monthly mean of 22.2 degrees Celsius and a monthly mean temperature of 27.7 degrees Celsius at the coast in Kilwa Masoko.[10] Lindi is home to a number of major rivers, the largest being Mbwemkuru River. Other major rivers are Matandu River, Lukuledi River and Mavuji River. Some tributary rivers of the Rufiji River that begin in Lindi Region are Njenje River and Lukuliro River.
Lindi Region is also home to the Tendaguru Formation, a Late Jurassic fossil record, where a complete skeleton of the largest land animals to ever exist; Giraffatitan was discovered by German colonizers during their occupation of the territory in the early 20th century. Other fossils that were found there are the Kentrosaurus, Janenschia, Tornieria, Tendaguria, Dysalotosaurus, Australodocus, Elaphrosaurus, Veterupristisaurus and Dicraeosaurus species of dinosaurs.[11]
_(17977534130).jpg.webp)

Flora and Fauna
Much of the western part of the Lindi Region is in the Nyerere National Park and Selous Game Reserve covering 27% of the total Lindi soil at roughly 18,000 square kilometers, equivalent to the size of the nation of Kuwait.[8] Lindi Region hosts both native African savanna wildlife and also Indian Ocean fauna. The regional bird is the Malachite Kingfisher is found in more numbers in Lindi, especially at the Selous game reserve and Nyerere National Park. In terms of flora the tamarind tree is found in abundance as it is cultivated together with the cashew tree. Lindi is also home to many native trees include the miombo or ebony tree as well as other common savannah flora found in neighbouring regions and countries.[12]
Kitope (8 Km2) and Mbinga are two small forest remnants in the Lindi Region (6 Km2). Others include the Km2, Ringo, and Maleshi Forest Reserves, as well as Nanyoma Caves (which have a 4 acre trial patch of mninga trees). Low-lying plants and forest are present in Ngarama North and South. According to Erikson et al. in 1994, the Pindiro Forest has at least 15 hectares of swamp forest. Mpingo and woodland grassland predominate in Matapwa Forest Reserve. A section of baobab forest may be found in Kikwetu's Municipal Council borders, to the east of Lindi Airport. [13]
On the Noto Plateau, there is a sizable area of forest: Makangela, which contains miombo woodland, is located on the southern side of the main road between Rutamba and Lilola. Another is Mnacho, a 1 square kilometer area of thickets and shrubs planted with acacia siamea in 1978 to provide woodfuel for the town of Lindi. It is located on the road between Lindi and Mingoyo/Mnazi Mmoja. This is now a part of the Lindi Municipality, along with the Mkunguru forest, which is located about 20 km south of the Lindi Creek. Despite being degazetted in 1960 (GN No 487), the Livengula Forest Reserve, which is next to Lake Narunyu and directly to the north of the coconut plantation, continues to be a cashewnut woods. The Mtama Forest is situated 2 km from Masasi. The woodlands of Lionjo and Nyera/Kiperere in the Liwale and Nachingwea Districts are close to the Liwale to Nachingwea Road. The least vulnerable coastal forest in Tanzania is Lungonya Forest, which is located in the Seleou Game Reserve's far north-east corner and is far from any populated areas.[14]
Economy
In terms of GDP, the regional economy of Lindi makes a very small contribution to the national economy, accounting for only about 2% of GDP. This is a result of the potentials not being fully utilized to contribute to the national economy generally and the regional economy specifically. In fact, Singida, Pwani, and Lindi are the three regions that contribute the least to the GDP of the nation; Dar es Salaam, Mwanza, and Mbeya are the two regions that contribute the most. With 1,127,104 TZS annually, Lindi is ranked 11th out of 21 Tanzanian regions, followed by Rukwa, Mara, and Mtwara with 1,116,699 TZS, 1,095,641 TZS, and 1,041,805 TZS, respectively. Dar es Salaam tops the list with 1,990,043 TZS, and Iringa comes second with 1,660,532 TZS per person. However, throughout the years 2000 to 2013, the Coast area, Singida, or both trailed Lindi region in terms of regional GDP annual contribution, coming in at 19 or 20.[15]
Agriculture, forestry, fishing, mining and quarrying, trade and commerce, public administration, and education are the main economic sectors in which the working population in the Lindi region is employed. According to the Lindi 2016 socioeconomic profile, commercial agriculture and farming of food crops employed more people than any other industry by an astounding 80 percent, followed by "Trade and Commerce" at 4.3 percent and "Mining and Quarrying" at 2.2 percent. Electricity, Gas, and Water as well as Communication and Transport each employed 0.1 percent of the total workforce in the area. In the Lindi region, farming was the most prevalent occupation, employing around 79.5 percent of the working population. Livestock keepers, on the other hand, made up about 0.2 percent of the working population.[16]
Agriculture
Agriculture is the main employer in the Lindi Region. Out of the 224,316 households in the region, 180,877 (or 81 percent) were involved in agriculture in some capacity. These homes were primarily located in the Lindi District Council (44,583 households). 15 percent of households (26,817 households) in urban areas engaged in agricultural activity in the agricultural year 2011–12. This indicates that agriculture is also an economic activity in urban regions. Additionally, it was discovered that the percentage of households engaged in agriculture varied from 86 percent in Nachingwea District Council to 62 percent in Lindi Municipal.[17]
The region is divided into two main agro-ecological zones; the coastal zone which is the main cultivation of tree crops such as cashew, coconut and mango. These areas are Lindi and Kilwa districts respectively with an elevation of 0 to 400 meters. Roughly 10% of farmers commercially grow cashews for export. The second agro-ecological zone is the midlands where the main cultivation of crops include maize, African rice, sesame and cassava. These areas are mostly Liwale and Nachingwea districts with an elevation of 300 to 900 meters above sea level. Rearing of livestock is still low in Lindi compared to other regions.[10]
Industry
There are hardly any manufacturing industries in the Lindi region. The Region had one sawmill (ISIC 161), one manufacturer of chemical products (ISIC 202), and one furniture manufacturer, per the 2009 Annual Survey of Industrial Production for enterprises employing 10 and above persons.[18]
Fisheries and Forestry
Between Sudi village in the south of the Lindi district and Marendego village in the north of Kilwa, Lindi Region has the longest coastline in the country at 287 kilometers long. Lindi also has some of the most productive fish stocks in Tanzania. Only 876 out of 224,316 households (0.4 percent) engaged in fish farming activities. Fish farming is primarily done in rural areas, with some urban areas as well. In addition, it was noted that 22.1 percent of households engaged in fish farming were urban and 77.9 percent were rural.[19]
The region has more than 2,430 registered fishing vessels (most are dugout canoes and dhow). There are over 11,523 fishermen registered in the Lindi region. The fishing is done is organised into 28 fishing groups. currently, there are 6 groups in Kilwa district, 14 in Lindi Town, and 8 in Lindi district. Aquaculture is significant in the region with 125 saltwater fish farms and 148 freshwater fish farms.[10] Fish stocking in man-made dams, sea weed farming, and fishing in the ocean, rivers, and dams are all part of the region's fishing industry. The Indian Ocean, River Lukuredi, Lake Rutamba, and dams are the region's natural water sources, which all support fishing.[20]
People who live near the water produce seaweed, hence the ocean's presence encourages seaweed cultivation as a source of income in the Lindi district, Lindi municipality, and Kilwa. Spinosum (red sea weed) and cotonii are the two forms of sea weed that are generated in greater quantities in the Lindi region (green sea weed). However, a variety of issues, including a drop in seaweed prices and illnesses, are causing a yearly fall in seaweed yield.[21]
Lindi is one of the most forested regions in Tanzania with 57.17% of the region being covered in forests. 38% of these forested lands are within Nyerere National Park and Selous Game Reserve. Moreover, 6% of land in the Lindi Region is part of the National Forest Reserves. In addition, 12% of the forests are managed under village forest reserves. Sustainable honey production is an area the government is exploring commercial interests in the forest reserves.[10]
Mining and natural gas
Lindi engages in salt mining on a local scale especially in Kilwa district, also Kilwa district has deposits of high quality gypsum near Kiranjeranje ward. Ruangwa district is known for its graphite deposits. As of 2019, 60 exploration wells have been drilled in the Songo Songo islands in Kilwa district, containing fifty-five trillion cubic feet of natural gas reserves.[10] The region has issued around 2282 mineral licenses, of which only Kilwa district, with about 1260 licenses, has issued about 55.2% of them, and Lindi Municipal Council, with only 101 licenses. Of these 99 licenses are for small-scale mining, while the other two are for limestone exploration. The mining licenses awarded cover a variety of activities, including exploration (prospecting and retention), mining (small, medium, and large scales), processing, smelting, and reefing, as well as mineral business (dealer's and broker's) licenses. Graphite, feldspar, salt, coal, gold, marble, nickel, copper, manganese, iron ore, limestone, gem, gypsum, and other minerals may be found in Lindi.[22]
Tourism
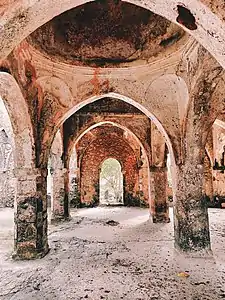
Lindi is the only Tanzanian region that hosts two of Tanzania's UNESCO World Heritage Site, within its borders, namely, Selous Game Reserve and the ruins of Kilwa Kisiwani and Songo Mnara[23] Lindi offers attractions for cultural/historic tourism, sun and sand tourism, and also wildlife safari tourism. There is also an unexplored cave system called the Nangoma caves near Matumbi Highlands in Kilwa District.
Population
Lindi Region despite its size is home to only 5 indigenous ethnic groups. It is the ancestral home to the Mwera people located on the central east coast of the Lindi Region, the majority in Kilwa District. Most of western Lindi is home to the Ngindo people, the majority in Liwale District. The Matumbi people are mostly found in the northern Lindi Region bordering Pwani Region. Machinga people are a small minority with Kilwa District in the eastern Lindi Region. Lastly the Makonde people are found on the south-eastern corner of Lindi Region.[24] The life expectancy of Lindi residents is 63.8 years. In terms of regional cuisine, "Chipwenye," a traditional dish made of a blend of Bambara beans and maize, is a popular choice (njugu mawe).[25]
The majority of Lindi Region residents practice Sunni Islam with elements of African traditional faiths since the introduction of Islam to the Lindi coast through trade during the Swahili era in the 9th and 10th centuries. There is a small but significant Christian population. As in most of Tanzania, many urban centers like Liwale town, Kilwa Masoko, and Lindi town have a mixture of people from all over the country including a small Indian and Arab immigrant community. The bulk of foreigners counted in the area were from Kenya, China, Mozambique, and India. Other nations with sizable populations of foreigners in the area were Germany and Lesotho.[26]
Demographics
Lindi Region's population in 2012 was around 864,652,[27] making Lindi the region with the lowest population densities in the country at 51 persons per square kilometer. The population of the Lindi Region increased by 0.9 percent between 2002 and 2012. While the population growth rate in urban regions was 2.5 percent, it was only 0.6 percent in rural areas.
The Lindi Region's average yearly growth rate dropped from 1.4 percent between 1988 and 2002 to 0.9 percent between 2002 and 2012. Between the 2002 and 2012 Censuses, the population of the Lindi Region as a whole increased by 9.8%. However, over a 14-year period (1988–2002), the population of the Lindi Region as a whole has grown by 1.4%. All Lindi districts saw population growth between the 2002 and 2012 Censuses. Ruangwa District experienced the smallest population change, while Lindi Municipal Council experienced the biggest (91.9%) (5.7 percent). The district with the highest population proportion, accounting for 22.5 percent of the region's total population (194,143 people), was Lindi District Council, while the district with the lowest, accounting for 9.1 percent (78,841 persons). [28]
There were 92 men for every 100 women in the Lindi Region overall. (99 for rural areas and 90 for urban areas show that there are more women than men living there. The sex ratio, however, was above 100 for the population in the age categories of 5 to 19 years, 50 to 54 years, and 75 to 79 years in the Lindi region, while it was above 100 for the population in the age groups of 5 to 19 years and 75 to 79 years in the Lindi rural area. In contrast, Lindi's urban sex ratio was greater than 100 for people aged 50 to 64 and 75 to 79, and it was equal for children aged 0 to 4 years. The 2012 Census showed that the Lindi region has a young population, with 50.5% of the territory's inhabitants being under the age of 15. Ages 65 and over make up just six percent of the region's total population.[29] As of 2019, the projected Lindi Region population was 1,004,439. This shows that Lindi Region is growing at a small pace compared to other regions at 0.9% per annum.[10] With the current growth rate projection Lindi will only add 54,240 people by 2025.
The regional commissioner of the Lindi Region is Godfrey Zambi.[30]
Administrative divisions
Districts
Lindi Region is divided into six districts, each administered by a council:
| Districts of Lindi Region | ||||||
|---|---|---|---|---|---|---|
| Map | District | Population (2012) | ||||
 |
Kilwa District | 190,744 | ||||
| Lindi District | 194,143 | |||||
| Liwale District | 91,380 | |||||
| Nachingwea District | 178,464 | |||||
| Ruangwa District | 131,080 | |||||
| Lindi Municipal District | 78,841 | |||||
| Total | 864,652 | |||||
Health and Education
Literacy
Urban regions of Lindi had a substantially higher literacy rate (74.3%) than did rural areas (60.6 percent). While in both rural and urban areas, men had higher literacy rates than women.Adult literacy in the Lindi Region is 68.0 percent, with urban regions having a higher rate (77.2 percent) than rural ones (65.7 percent). In both rural and urban areas, males had higher literacy rates than females.District-level adult literacy rates range from 75.7% in Nachingwea District to 60.3% in Lindi District (Map 9.1). Liwale District (73.2%) and Lindi Municipal District were the districts with literacy rates above 70 percent (72.7 percent).
Adult literacy rates in Ruangwa District increased from 58.1 percent in 2002 to 67 percent in 2012 and in Lindi Municipal from 69.9 percent to 72.7 percent in 2012. The percentage change in these districts ranges from 2.8 percent in Lindi Municipal to 13.1 percent in Kilwa District, indicating an increase in literacy rates between the 2002 and 2012 censuses. For people aged 5 and older, the literacy rate improved from 54.4 to 63.2 percent, and for people aged 15 and older, it went from 59.1 to 68 percent. Male and female literacy rates among those aged 5 and older have likewise increased, from 61.1 to 67.8 percent for men and 48.4 to 59 percent for women. Ruangwa District Council (40.9%), Kilwa (43.4%), and Lindi District Council (43.4%) have the highest rates of illiteracy (37 percent). The district councils with the lowest rates of illiteracy were Nachingwea District Council and Lindi Municipal Council, both at 29.7%. (29.5 percent).[31]
Education
Compared to the urban population, where the percentage was just 21%, 33% of rural residents had never attended school. Similarly, the percentage of dropouts was marginally greater in rural (9.0%) than in urban (8.4%) areas. However, compared to rural areas, metropolitan areas had a substantially larger percentage of people who had completed their education (41.9%). (34.9 percent). The similar arrangement holds true for those who were actively enrolled, with 23.1 percent of the rural population and 28.7 percent of the urban population both attending school.Liwale District Council had the highest district council attendance percentage (26.9%), followed by Lindi Municipal Council (26.4%) and Nachingwea District Council (23.4%). (25.4 percent). Ruangwa District Council (20.8%) and Lindi District Council (22.2%) had the lowest attendance rates, respectively.[32]
Between the 2002 and 2012 Censuses, there was an improvement in educational attainment levels. The percentage of the population with a secondary education climbed from 5.12 percent to 7.7 percent, and the percentage with a university degree or an equivalent level increased from 0.09 percent to 0.7 percent. The growth of secondary schools and rise in secondary school enrollment are the reason for the startling rise in the percentage of students in secondary schools compared to primary schools. In the 267,844 people who attained any level of education, according to the 2012 census, 134,987 (50.4%) were men and 132,857 (49.6%) were women. 90.6 percent of people completed primary school, which was followed by secondary education (7.7 percent), university, and other levels (0.7 percent). The findings also indicate that compared to men, more women (92.3 percent) have completed their primary school (88.9 percent). The situation was reversed at the secondary level and above, when 7.7% of people had a secondary education and 0.4% had a university degree or an equivalent level.[33]
Notable persons from Lindi Region
- Kinjikitile Ngwale, freedom fighter and spiritual leader
- Kassim Majaliwa, 10th Tanzanian Prime Minister
- Mohammed Abdi Abdulaziz, politician
References
- ↑ "Lindi Region history". Lindi Government. Retrieved 2022-07-22.
- ↑ "IS0 3166". ISO. Retrieved 2022-07-22.
- ↑ "Sub-national HDI - Area Database - Global Data Lab". hdi.globaldatalab.org. Archived from the original on 2018-09-23. Retrieved 2020-02-26.
- ↑ "Lindi Region Size".
- ↑ 65,610 km2 (25,330 sq mi) for Sri Lanka at "Area size comparison". Nations Online. 2022. Retrieved 22 July 2022.
- ↑ Allen, J V. (22 July 2022). Swahili Origins: Swahili Culture & the Shungwaya Phenomenon. London: J.Currey. p. 93. ISBN 978-0852550762. OCLC 25747036.
- 1 2 3 Population Distribution by Administrative Units, United Republic of Tanzania, 2013 Archived 2013-06-12 at the Wayback Machine
- 1 2 "Historia | Lindi Region". www.lindi.go.tz. Archived from the original on 2021-07-24. Retrieved 2021-07-24.
- ↑ "Lindi Peaks". Archived from the original on 27 October 2021. Retrieved 13 October 2021.
- 1 2 3 4 5 6 "Lindi Region Investment Guide" (PDF). Archived (PDF) from the original on 24 July 2021. Retrieved 24 July 2021.
- ↑ Sames, B (2009). "The Tendaguru formation of southeastern Tanzania, East Africa: An alternating Late Jurassic to Early Cretaceous palaeoenvironment of exceptional status". Egu General Assembly Conference Abstracts: 5283. Bibcode:2009EGUGA..11.5283S. Retrieved 22 July 2022.
- ↑ "Selous Game Reserve Tanzania (Nyerere National Park) A Safari Guide". Selous Game Reserve. Archived from the original on 2021-07-24. Retrieved 2021-07-25.
- ↑ Lindi Municipal Master Plan (PDF) (Regional Guide). Lindi Municipal Master Plan: Ministry of Lands, Tanzania. 2019. Retrieved 21 December 2022.
- ↑ Lindi Municipal Master Plan (PDF) (Regional Guide). Lindi Municipal Master Plan: Ministry of Lands, Tanzania. 2019. Retrieved 21 December 2022.
- ↑ Lindi Municipal Master Plan (PDF) (Regional Guide). Lindi Municipal Master Plan: Ministry of Lands, Tanzania. 2019. Retrieved 21 December 2022.
- ↑ Lindi Municipal Master Plan (PDF) (Regional Guide). Lindi Municipal Master Plan: Ministry of Lands, Tanzania. 2019. Retrieved 21 December 2022.
- ↑ Lindi Region Socio-economic Profile 2016 (PDF) (Regional Guide). Lindi Region: Lindi Government, Tanzania. 2016. Retrieved 21 December 2022.
- ↑ Lindi Municipal Master Plan (PDF) (Regional Guide). Lindi Municipal Master Plan: Ministry of Lands, Tanzania. 2019. Retrieved 21 December 2022.
- ↑ Lindi Region Socio-economic Profile 2016 (PDF) (Regional Guide). Lindi Region: Lindi Government, Tanzania. 2016. Retrieved 21 December 2022.
- ↑ Lindi Municipal Master Plan (PDF) (Regional Guide). Lindi Municipal Master Plan: Ministry of Lands, Tanzania. 2019. Retrieved 21 December 2022.
- ↑ Lindi Municipal Master Plan (PDF) (Regional Guide). Lindi Municipal Master Plan: Ministry of Lands, Tanzania. 2019. Retrieved 21 December 2022.
- ↑ Lindi Municipal Master Plan (PDF) (Regional Guide). Lindi Municipal Master Plan: Ministry of Lands, Tanzania. 2019. Retrieved 21 December 2022.
- ↑ MASTER PLAN, Lindi Regional Commissioner, Lindi, 2019 Archived 2021-07-12 at the Wayback Machine
- ↑ "Tanzania - People". www.globalsecurity.org. Archived from the original on 2021-07-24. Retrieved 2021-07-24.
- ↑ Lindi Municipal Master Plan (PDF) (Regional Guide). Lindi Municipal Master Plan: Ministry of Lands, Tanzania. 2019. Retrieved 21 December 2022.
- ↑ Lindi Region Socio-economic Profile 2016 (PDF) (Regional Guide). Lindi Region: Njombe Government, Tanzania. 2016. Retrieved 21 December 2022.
- ↑ "Social Economics of Tanzania, 2016 - Tanzania Data Portal". tanzania.opendataforafrica.org. Archived from the original on 2021-07-24. Retrieved 2021-07-24.
- ↑ Lindi Region Socio-economic Profile 2016 (PDF) (Regional Guide). Lindi Region: Lindi Government, Tanzania. 2016. Retrieved 21 December 2022.
- ↑ Lindi Region Socio-economic Profile 2016 (PDF) (Regional Guide). Lindi Region: Njombe Government, Tanzania. 2016. Retrieved 21 December 2022.
- ↑ wa Lindi , Tanzania Government Directory, 2019
- ↑ Lindi Region Socio-economic Profile 2016 (PDF) (Regional Guide). Lindi Region: Lindi Government, Tanzania. 2016. Retrieved 21 December 2022.
- ↑ Lindi Region Socio-economic Profile 2016 (PDF) (Regional Guide). Lindi Region: Lindi Government, Tanzania. 2016. Retrieved 21 December 2022.
- ↑ Lindi Region Socio-economic Profile 2016 (PDF) (Regional Guide). Lindi Region: Lindi Government, Tanzania. 2016. Retrieved 21 December 2022.