Lintong
临潼区 Lintung | |||||||||||||||||||||||||||||||||||
|---|---|---|---|---|---|---|---|---|---|---|---|---|---|---|---|---|---|---|---|---|---|---|---|---|---|---|---|---|---|---|---|---|---|---|---|
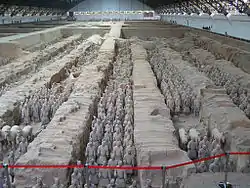
 The Terracotta Army | |||||||||||||||||||||||||||||||||||
| Coordinates: 34°22′31″N 109°13′04″E / 34.3754°N 109.2177°E[1] | |||||||||||||||||||||||||||||||||||
| Country | People's Republic of China | ||||||||||||||||||||||||||||||||||
| Province | Shaanxi | ||||||||||||||||||||||||||||||||||
| Sub-provincial city | Xi'an | ||||||||||||||||||||||||||||||||||
| Area | |||||||||||||||||||||||||||||||||||
| • Total | 915.97 km2 (353.66 sq mi) | ||||||||||||||||||||||||||||||||||
| Population (2010)[2] | |||||||||||||||||||||||||||||||||||
| • Total | 655,874 | ||||||||||||||||||||||||||||||||||
| • Density | 716.04/km2 (1,854.5/sq mi) | ||||||||||||||||||||||||||||||||||
| Time zone | UTC+8 (China Standard) | ||||||||||||||||||||||||||||||||||
| Postal code | 7106XX | ||||||||||||||||||||||||||||||||||
| Xi'an district map |
| ||||||||||||||||||||||||||||||||||
| Website | lintong | ||||||||||||||||||||||||||||||||||
Lintong District (simplified Chinese: 临潼区; traditional Chinese: 臨潼區; pinyin: Líntóng Qū), formerly Lintong County, is one of 11 urban districts of the prefecture-level city of Xi'an, the capital of Shaanxi Province, Northwest China. The district was approved to establish from the former Lintong County (临潼县) by the Chinese State Council on June 25, 1997.[3] The Terracotta Army and the Mausoleum of the First Qin Emperor was discovered in March 1974 near this district. The district borders the prefecture-level cities of Xianyang to the northwest and Weinan to the east, Gaoling County to the northeast, Baqiao District to the southeast, Lianhu and Xincheng Districts to the south, and Chang'an District to the southwest.
Artifacts from the tomb of Qin Shi Huang, China's first emperor, can be viewed at the Emperor Qinshihuang's Mausoleum Site Museum (秦始皇帝陵博物院) in Lintong District.
The National Time Service Center, the Chinese Academy of Sciences (中国科学院国家授时中心), formerly known as Shaanxi Astronomical Observatory (陕西天文台), was established in 1966 in Lintong responsible for the time standard in mainland China. It was renamed to its present name in 2001.
The name of the district comes from two rivers. Lin river is on the east side and Tong river is on the west side of the district.
Lintong is headquarters of the 47th Group Army of the People's Liberation Army, one of the two group armies that comprise the Lanzhou Military Region responsible for defending China's northwest borders.
Administrative divisions
As 2020, Lintong District is divided to 23 subdistricts.[4]
- Subdistricts
|
|
Climate
| Climate data for Lintong District (1991−2020 normals) | |||||||||||||
|---|---|---|---|---|---|---|---|---|---|---|---|---|---|
| Month | Jan | Feb | Mar | Apr | May | Jun | Jul | Aug | Sep | Oct | Nov | Dec | Year |
| Mean daily maximum °C (°F) | 5.1 (41.2) |
9.6 (49.3) |
15.9 (60.6) |
22.4 (72.3) |
27.3 (81.1) |
32.0 (89.6) |
32.9 (91.2) |
30.7 (87.3) |
25.6 (78.1) |
19.6 (67.3) |
12.7 (54.9) |
6.6 (43.9) |
20.0 (68.1) |
| Daily mean °C (°F) | 0.0 (32.0) |
3.9 (39.0) |
9.7 (49.5) |
15.8 (60.4) |
20.7 (69.3) |
25.6 (78.1) |
27.2 (81.0) |
25.2 (77.4) |
20.1 (68.2) |
14.1 (57.4) |
7.3 (45.1) |
1.5 (34.7) |
14.3 (57.7) |
| Mean daily minimum °C (°F) | −4.1 (24.6) |
−0.7 (30.7) |
4.4 (39.9) |
9.8 (49.6) |
14.3 (57.7) |
19.3 (66.7) |
22.1 (71.8) |
20.7 (69.3) |
15.8 (60.4) |
9.8 (49.6) |
3.0 (37.4) |
−2.6 (27.3) |
9.3 (48.7) |
| Average precipitation mm (inches) | 5.8 (0.23) |
10.5 (0.41) |
23.5 (0.93) |
43.8 (1.72) |
61.9 (2.44) |
67.4 (2.65) |
92.6 (3.65) |
93.4 (3.68) |
98.9 (3.89) |
59.9 (2.36) |
27.2 (1.07) |
5.1 (0.20) |
590 (23.23) |
| Average precipitation days (≥ 0.1 mm) | 3.7 | 4.1 | 5.7 | 7.0 | 8.5 | 8.1 | 9.7 | 9.3 | 11.5 | 9.2 | 5.7 | 3.0 | 85.5 |
| Average snowy days | 4.2 | 3.0 | 1.3 | 0.1 | 0 | 0 | 0 | 0 | 0 | 0 | 1.2 | 2.8 | 12.6 |
| Average relative humidity (%) | 61 | 60 | 59 | 61 | 61 | 59 | 70 | 76 | 79 | 77 | 72 | 63 | 67 |
| Mean monthly sunshine hours | 126.4 | 130.0 | 169.8 | 202.1 | 215.2 | 218.5 | 220.9 | 192.6 | 141.5 | 125.2 | 125.4 | 130.0 | 1,997.6 |
| Percent possible sunshine | 40 | 42 | 45 | 51 | 50 | 51 | 51 | 47 | 39 | 36 | 41 | 43 | 45 |
| Source: China Meteorological Administration[5][6] | |||||||||||||
References
- ↑ Google (2014-07-02). "Lintong" (Map). Google Maps. Google. Retrieved 2014-07-02.
- ↑ "西安市2010年第六次全国人口普查主要数据公报" (in Chinese). Xi'an Evening News (西安晚报). 25 May 2011. Retrieved 3 July 2014.
- ↑ 临潼区历史沿革 (in Simplified Chinese). xzqh.org. 2015-04-08. Retrieved 2019-07-19.
- ↑ 2020年统计用区划代码(临潼区) (in Chinese). National Bureau of Statistics of China. 2020. Archived from the original on 2020-11-29. Retrieved 2020-12-03.
- ↑ 中国气象数据网 – WeatherBk Data (in Simplified Chinese). China Meteorological Administration. Retrieved 26 August 2023.
- ↑ 中国气象数据网 (in Simplified Chinese). China Meteorological Administration. Retrieved 26 August 2023.
External links

