| Minnesota's 7th congressional district | |||
|---|---|---|---|
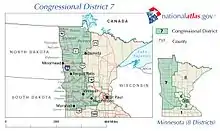
Interactive map of district boundaries from January 3, 2023 | |||
| Representative |
| ||
| Area | 31,796[1] sq mi (82,350 km2) | ||
| Distribution |
| ||
| Population (2022) | 713,848[3] | ||
| Median household income | $70,672[4] | ||
| Ethnicity |
| ||
| Cook PVI | R+19[5] | ||
.svg.png.webp)
| External image | |
|---|---|
Minnesota's 7th congressional district covers the majority of western Minnesota. It is by far the state's largest district, and has a very rural character. Except for a few southern counties in the 1st district, the 7th includes almost all of Western Minnesota. Cities in the district include Moorhead (its largest city), Fergus Falls, Alexandria and Willmar.
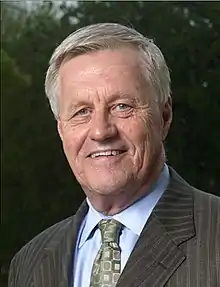
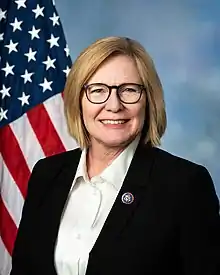
With a Cook Partisan Voting Index rating of R+19, it is the most Republican district in Minnesota.[5] The district is currently represented by Republican Michelle Fischbach. Despite this, it was represented by DFL member Collin Peterson from 1991 to 2021; Peterson was considered one of the most conservative Democrats in the House.
Election results from statewide races
Election results from presidential races:
| Year | Office | Results |
|---|---|---|
| 2000 | President | George W. Bush 54 - Al Gore 40% |
| 2004 | President | George W. Bush 55 - John Kerry 43% |
| 2008 | President | John McCain 50 - Barack Obama 47% |
| 2012 | President | Mitt Romney 54 - Barack Obama 44% |
| 2016 | President | Donald Trump 62 - Hillary Clinton 31% |
| 2020 | President | Donald Trump 63 - Joe Biden 34% |
Demographics
According to the APM Research Lab's Voter Profile Tools[6] (featuring the U.S. Census Bureau's 2019 American Community Survey), the district contained about 501,000 potential voters (citizens, age 18+). Of these, 91% are White and 9% are people of color. Immigrants make up 2% of the district's potential voters. Median income among households (with one or more potential voter) in the district is about $61,000, while 9% of households live below the poverty line. As for the educational attainment of potential voters in the district, 8% of those 25 and older have not earned a high school degree, while 22% hold a bachelor's or higher degree.
List of members representing the district

.jpg.webp)
.tif.jpg.webp)


Recent election results
2002
| Party | Candidate | Votes | % | ±% | |
|---|---|---|---|---|---|
| Democratic (DFL) | Collin Peterson (incumbent) | 170,234 | 65.27 | - | |
| Republican | Dan Stevens | 90,342 | 34.64 | - | |
2004
| Party | Candidate | Votes | % | ±% | |
|---|---|---|---|---|---|
| Democratic (DFL) | Collin Peterson (incumbent) | 207,628 | 66.07 | +1 | |
| Republican | David Sturrock | 106,349 | 33.84 | - | |
2006
| Party | Candidate | Votes | % | ±% | |
|---|---|---|---|---|---|
| Democratic (DFL) | Collin Peterson (incumbent) | 179,164 | 70 | +4 | |
| Republican | Michael Barrett | 74,557 | 29 | - | |
| Constitution | Ken Lucier | 3,303 | 1 | - | |
2008
| Party | Candidate | Votes | % | ±% | |
|---|---|---|---|---|---|
| Democratic (DFL) | Collin Peterson (incumbent) | 227,180 | 72.20 | +2.2 | |
| Republican | Glen Menze | 87,062 | 27.67 | - | |
| N/A | others | 431 | 0.14 | - | |
2010
| Party | Candidate | Votes | % | ±% | |
|---|---|---|---|---|---|
| Democratic (DFL) | Collin Peterson (incumbent) | 159,479 | 52.5 | -19.7 | |
| Republican | Lee Byberg | 90,650 | 37.6 | +9.2 | |
| N/A | others | 17,155 | 7.2 | - | |
2012
| Party | Candidate | Votes | % | ±% | |
|---|---|---|---|---|---|
| Democratic (DFL) | Collin Peterson (incumbent) | 197,791 | 60.4 | +7.9 | |
| Republican | Lee Byberg | 114,151 | 34.8 | -2.8 | |
| N/A | others | 4.7 | - | ||
2014
| Party | Candidate | Votes | % | ±% | |
|---|---|---|---|---|---|
| Democratic (DFL) | Collin Peterson (incumbent) | 130,546 | 54.2 | -6.2 | |
| Republican | Torrey Westrom | 109,955 | 45.7 | +10.9 | |
| N/A | others | 334 | 0.1 | - | |
2016
| Party | Candidate | Votes | % | ±% | |
|---|---|---|---|---|---|
| Democratic (DFL) | Collin Peterson (incumbent) | 173,589 | 52.5 | -1.7 | |
| Republican | Dave Hughes | 156,952 | 47.4 | +1.7 | |
| N/A | others | 307 | 0.1 | - | |
2018
| Party | Candidate | Votes | % | ±% | |
|---|---|---|---|---|---|
| Democratic (DFL) | Collin Peterson (incumbent) | 146,672 | 52.1 | -0.4 | |
| Republican | Dave Hughes | 134,668 | 47.9 | +0.5 | |
| N/A | others | 168 | <0.1 | -0.1 | |
2020
| Party | Candidate | Votes | % | |
|---|---|---|---|---|
| Republican | Michelle Fischbach | 194,066 | 53.4 | |
| Democratic (DFL) | Collin Peterson (incumbent) | 144,840 | 39.8 | |
| Legal Marijuana Now | Slater Johnson | 17,710 | 4.9 | |
| Grassroots | Rae Hart Anderson | 6,499 | 1.8 | |
| Write-in | 362 | 0.1 | ||
2022
| Party | Candidate | Votes | % | |
|---|---|---|---|---|
| Republican | Michelle Fischbach (incumbent) | 204,755 | 67.0 | |
| Democratic (DFL) | Jill Abahsain | 84,447 | 27.6 | |
| Independent | Travis Johnson | 16,421 | 5.4 | |
Historical district boundaries
.tif.png.webp)
See also
References
- ↑ "Minnesota congressional districts by urban and rural population and land area" (PDF). US Census Bureau. 2000. Retrieved April 2, 2007.
- ↑ Geography, US Census Bureau. "Congressional Districts Relationship Files (state-based)". www.census.gov. Retrieved April 7, 2018.
- ↑ Bureau, Center for New Media & Promotion (CNMP), US Census. "My Congressional District". www.census.gov. Retrieved October 5, 2023.
{{cite web}}: CS1 maint: multiple names: authors list (link) - ↑ "My Congressional District".
- 1 2 "2022 Cook PVI: District Map and List". Cook Political Report. Retrieved January 10, 2023.
- ↑ "Representing US: 2020 Voter Profiles". APM Research Lab. Retrieved October 22, 2020.