In materials science, misorientation is the difference in crystallographic orientation between two crystallites in a polycrystalline material.
In crystalline materials, the orientation of a crystallite is defined by a transformation from a sample reference frame (i.e. defined by the direction of a rolling or extrusion process and two orthogonal directions) to the local reference frame of the crystalline lattice, as defined by the basis of the unit cell. In the same way, misorientation is the transformation necessary to move from one local crystal frame to some other crystal frame. That is, it is the distance in orientation space between two distinct orientations. If the orientations are specified in terms of matrices of direction cosines gA and gB, then the misorientation operator ∆gAB going from A to B can be defined as follows:
where the term is the reverse operation of gA, that is, transformation from crystal frame A back to the sample frame. This provides an alternate description of misorientation as the successive operation of transforming from the first crystal frame (A) back to the sample frame and subsequently to the new crystal frame (B).
Various methods can be used to represent this transformation operation, such as: Euler angles, Rodrigues vectors, axis/angle (where the axis is specified as a crystallographic direction), or unit quaternions.
Symmetry and misorientation
The effect of crystal symmetry on misorientations is to reduce the fraction of the full orientation space necessary to uniquely represent all possible misorientation relationships. For example, cubic crystals (i.e. FCC) have 24 symmetrically related orientations. Each of these orientations is physically indistinguishable, though mathematically distinct. Therefore, the size of orientation space is reduced by a factor of 24. This defines the fundamental zone (FZ) for cubic symmetries. For the misorientation between two cubic crystallites, each possesses its 24 inherent symmetries. In addition, there exists a switching symmetry, defined by:
which recognizes the invariance of misorientation to direction; A→B or B→A. The fraction of the total orientation space in the cubic-cubic fundamental zone for misorientation is then given by:
or 1/48 the volume of the cubic fundamental zone. This also has the effect of limiting the maximum unique misorientation angle to 62.8°
Disorientation describes the misorientation with the smallest possible rotation angle out of all symmetrically equivalent misorientations that fall within the FZ (usually specified as having an axis in the standard stereographic triangle for cubics). Calculation of these variants involves application of crystal symmetry operators to each of the orientations during the calculation of misorientation.
where Ocrys denotes one of the symmetry operators for the material.
Misorientation distribution

The misorientation distribution (MD) is analogous to the ODF used in characterizing texture. The MD describes the probability of the misorientation between any two grains falling into a range around a given misorientation . While similar to a probability density, the MD is not mathematically the same due to the normalization. The intensity in an MD is given as "multiples of random density" (MRD) with respect to the distribution expected in a material with uniformly distributed misorientations. The MD can be calculated by either series expansion, typically using generalized spherical harmonics, or by a discrete binning scheme, where each data point is assigned to a bin and accumulated.
Graphical representation

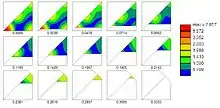
Discrete misorientations or the misorientation distribution can be fully described as plots in the Euler angle, axis/angle, or Rodrigues vector space. Unit quaternions, while computationally convenient, do not lend themselves to graphical representation because of their four-dimensional nature. For any of the representations, plots are usually constructed as sections through the fundamental zone; along φ2 in Euler angles, at increments of rotation angle for axis/angle, and at constant ρ3 (parallel to <001>) for Rodrigues. Due to the irregular shape of the cubic-cubic FZ, the plots are typically given as sections through the cubic FZ with the more restrictive boundaries overlaid.
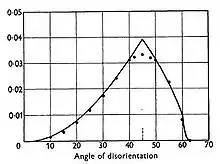
Mackenzie plots are a one-dimensional representation of the MD plotting the relative frequency of the misorientation angle, irrespective of the axis. Mackenzie determined the misorientation distribution for a cubic sample with a random texture.
Example of calculating misorientation
The following is an example of the algorithm for determining the axis/angle representation of misorientation between two texture components given as Euler angles:
- Copper [90,35,45]
- S3 [59,37,63]
The first step is converting the Euler angle representation, to an orientation matrix g by:
where and represent and of the respective Euler component. This yields the following orientation matrices:
The misorientation is then:
The axis/angle description (with the axis as a unit vector) is related to the misorientation matrix by:
(There are errors in the similar formulae for the components of 'r' given in the book by Randle and Engler (see refs.), which will be corrected in the next edition of their book. The above are the correct versions, note a different form for these equations has to be used if Θ = 180 degrees.)
For the copper—S3 misorientation given by ΔgAB, the axis/angle description is 19.5° about [0.689,0.623,0.369], which is only 2.3° from <221>. This result is only one of the 1152 symmetrically related possibilities but does specify the misorientation. This can be verified by considering all possible combinations of orientation symmetry (including switching symmetry).
References
- Kocks, U.F., C.N. Tomé, and H.-R. Wenk (1998). Texture and Anisotropy: Preferred Orientations in Polycrystals and their Effect on Materials Properties, Cambridge University Press.
- Mackenzie, J.K. (1958). Second Paper on the Statistics Associated with the Random Disorientation of Cubes, Biometrika 45,229.
- Randle, Valerie and Olaf Engler (2000). Introduction to Texture Analysis: Macrotexture, Microtexture & Orientation Mapping, CRC Press.
- Reed-Hill, Robert E. and Reza Abbaschian (1994). Physical Metallurgy Principles (Third Edition), PWS.
- Sutton, A.P. and R.W. Balluffi (1995). Interfaces in Crystalline Materials, Clarendon Press.
- G. Zhu, W. Mao and Y. Yu (1997). "Calculation of misorientation distribution between recrystallized grains and deformed matrix", Scripta mater. 42(2000) 37-41.