| New York's 25th congressional district | |||
|---|---|---|---|
Interactive map of district boundaries since January 3, 2023 | |||
| Representative |
| ||
| Distribution |
| ||
| Population (2022) | 768,169 | ||
| Median household income | $67,775[1] | ||
| Ethnicity |
| ||
| Cook PVI | D+7[2] | ||
New York's 25th congressional district is a congressional district for the United States House of Representatives. It is currently represented by Democrat Joseph Morelle. Since 2023, the district has been located within Monroe County and part of Orleans County, centered on the city of Rochester.
In the 2018 race, the seat was vacant. State Assembly Member Joseph Morelle (Democrat)[3] faced James Maxwell (Republican, Conservative, Reform),[4] in the general election, which Morelle won handily.[5] Morelle went on to win reelection in 2020 and 2022.
Recent statewide election results
| Year | Results |
|---|---|
| 1992 | Clinton 41–36% |
| 1996 | Clinton 51–38% |
| 2000 | Gore 51–45% |
| 2004 | Kerry 50–48% |
| 2008 | Obama 59–40% |
| 2012 | Obama 59–39% |
| 2016 | Clinton 56–39% |
| 2020 | Biden 60–37% |
History
Historically, most of this district was located in Upstate New York. In the 1960s, the 25th district was a Westchester/Rockland seat, covering areas now in the 17th and 18th districts. In the 1970s it was the lower Hudson Valley district and congruent to the present 19th district. Onondaga County was split between the 32nd district (which included rural counties east of Syracuse now in the 23rd and 24th districts) and the 33rd district (which included the Finger Lakes counties in the 24th and 29th districts).
In the 1980s, the district was centered in the Utica area (now the 24th district), and the Syracuse area was entirely in the 27th district. From 2003 to 2013, it stretched from Syracuse to the northeastern suburbs of Rochester. The district comprised Onondaga and Wayne counties, the northernmost portion of Cayuga County, and the towns of Irondequoit, Penfield, and Webster in Monroe County. The district included 100 miles of Lake Ontario shoreline, the easternmost Finger Lakes, and significant portions of the Erie Canal.

.tif.png.webp)
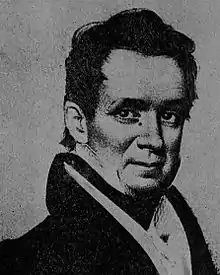
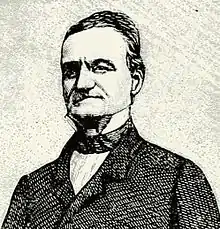
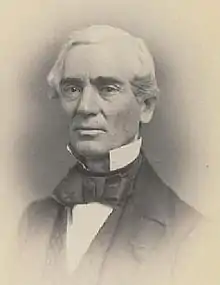
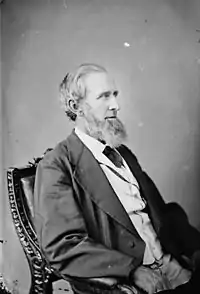
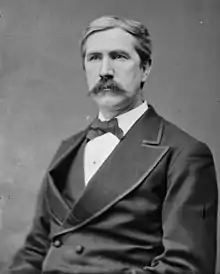
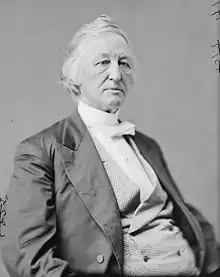
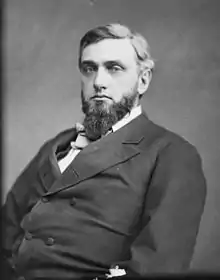
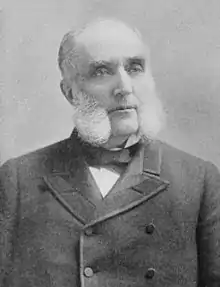
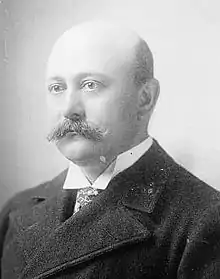
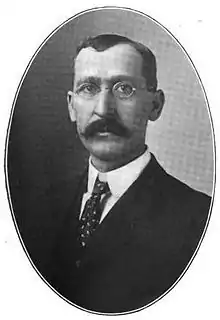
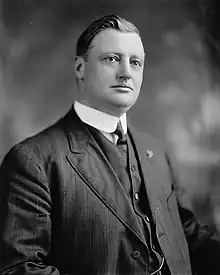
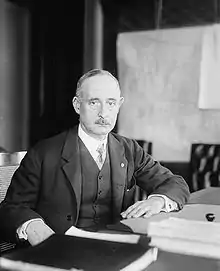
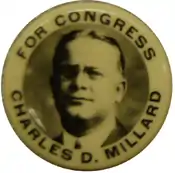
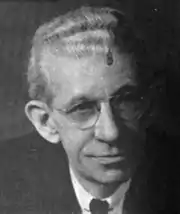
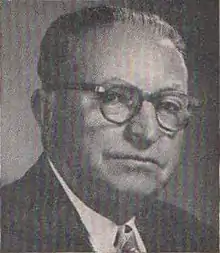
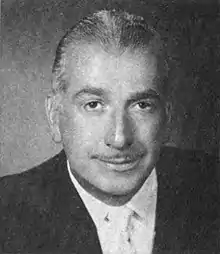
List of members representing the district
Election results
In New York State electoral politics, the state allows Electoral fusion, with numerous minor parties at various points on the political spectrum that typically endorse either the Republican or Democratic candidate for an office. Hence the state electoral results contain both the party votes, and the final candidate votes (Listed as "Recap").
| Party | Candidate | Votes | % | ±% | |
|---|---|---|---|---|---|
| Republican | James T. Walsh (incumbent) | 126,691 | 55.1 | ||
| Democratic | Marty Mack | 103,199 | 44.9 | ||
| Majority | 23,492 | 10.2 | |||
| Turnout | 229,890 | 100 | |||
| Party | Candidate | Votes | % | ±% | |
|---|---|---|---|---|---|
| Republican | James T. Walsh (incumbent) | 121,204 | 69.4 | +14.3 | |
| Democratic | Yvonne Rothenberg | 53,461 | 30.6 | −14.3 | |
| Majority | 67,743 | 38.8 | +28.6 | ||
| Turnout | 174,665 | 100 | −24.0 | ||
| Party | Candidate | Votes | % | ±% | |
|---|---|---|---|---|---|
| Republican | James T. Walsh (incumbent) | 151,880 | 69.0 | −0.4 | |
| Democratic | Francis J. Gavin | 64,533 | 29.3 | −1.3 | |
| Green | Howie Hawkins | 3,830 | 1.7 | +1.7 | |
| Majority | 87,347 | 39.7 | +0.9 | ||
| Turnout | 220,243 | 100 | +26.1 | ||
| Party | Candidate | Votes | % | ±% | |
|---|---|---|---|---|---|
| Republican | James T. Walsh (incumbent) | 144,610 | 72.3 | +3.3 | |
| Democratic | Stephanie Aldersley | 53,290 | 26.6 | −2.7 | |
| Working Families | Francis J. Gavin | 2,131 | 1.1 | +1.1 | |
| Majority | 91,320 | 45.7 | +6.0 | ||
| Turnout | 200,031 | 100 | −9.2 | ||
| Party | Candidate | Votes | % | ±% | |
|---|---|---|---|---|---|
| Republican | James T. Walsh (incumbent) | 189,063 | 90.4 | +18.1 | |
| Peace and Justice | Howie Hawkins | 20,106 | 9.6 | +9.6 | |
| Majority | 168,957 | 80.8 | +35.1 | ||
| Turnout | 209,169 | 100 | +4.6 | ||
| Party | Candidate | Votes | % | ±% | |
|---|---|---|---|---|---|
| Republican | James T. Walsh (incumbent) | 110,525 | 50.8 | −39.6 | |
| Democratic | Dan Maffei | 107,108 | 49.2 | +49.2 | |
| Majority | 3,417 | 1.6 | −79.2 | ||
| Turnout | 217,633 | 100 | +4.0 | ||
| Party | Candidate | Votes | % | ±% | |
|---|---|---|---|---|---|
| Democratic | Dan Maffei | 157,375 | 54.8 | +5.6 | |
| Republican | Dale Sweetland | 120,217 | 41.9 | −8.9 | |
| Green | Howie Hawkins | 9,483 | 3.3 | +3.3 | |
| Majority | 37,158 | 12.9 | +11.3 | ||
| Turnout | 287,075 | 100 | +31.9 | ||
| Party | Candidate | Votes | % | ±% | |
|---|---|---|---|---|---|
| Republican | Ann Marie Buerkle | 104,374 | 50.1 | +8.2 | |
| Democratic | Dan Maffei (incumbent) | 103,807 | 49.9 | −4.9 | |
| Turnout | 208,181 | 100 | −27.5 | ||
| Party | Candidate | Votes | % | ±% | |
|---|---|---|---|---|---|
| Democratic | Louise Slaughter | 168,761 | |||
| Working Families | Louise Slaughter | 11,049 | |||
| Total | Louise Slaughter (incumbent) | 179,810 | 57.4 | ||
| Republican | Maggie Brooks | 109,292 | |||
| Conservative | Maggie Brooks | 18,543 | |||
| Independence | Maggie Brooks | 5,554 | |||
| Total | Maggie Brooks | 133,389 | 42.6 | ||
| None | Blank/Void/Scattered | 9,561 | 0 | ||
| Total votes | 313,199 | 100.00 | |||
| Democratic hold | |||||
| Party | Candidate | Votes | % | ±% | |
|---|---|---|---|---|---|
| Democratic | Louise M. Slaughter | 87,264 | 44.41 | ||
| Working Families | Louise M. Slaughter | 9,539 | 4.85 | ||
| Total | Louise M. Slaughter (Incumbent) | 96,803 | 49.26 | ||
| Republican | Mark W. Assini | 75,990 | 38.67 | ||
| Conservative | Mark W. Assini | 19,942 | 10.15 | ||
| Total | Mark W. Assini | 95,932 | 48.82 | ||
| None | Blank/Void/Write-In | 3,781 | 1.92 | ||
| Total votes | 196,516 | 100 | |||
| Party | Candidate | Votes | % | ±% | |
|---|---|---|---|---|---|
| Democratic | Louise Slaughter | 168,660 | 50.14% | ||
| Working Families | Louise Slaughter | 10,195 | 3.03% | ||
| Women's Equality | Louise Slaughter | 4,095 | 1.22% | ||
| Total | Louise Slaughter (incumbent) | 182,950 | 54.39% | ||
| Republican | Mark Assini | 113,840 | 33.84% | ||
| Conservative | Mark Assini | 20,883 | 6.21% | ||
| Independence | Mark Assini | 6,856 | 2.04% | ||
| Reform | Mark Assini | 1,071 | 0.32% | ||
| Total | Mark Assini | 142,650 | 42.41% | ||
| None | Blank/Void/Scattering | 10,786 | 3.21% | ||
| Total votes | 336,386 | 100.00% | |||
| Democratic hold | |||||
| Party | Candidate | Votes | % | |
|---|---|---|---|---|
| Democratic | Joseph Morelle | 147,979 | 54.8 | |
| Working Families | Joseph Morelle | 4,575 | 1.7 | |
| Independence | Joseph Morelle | 4,585 | 1.7 | |
| Women's Equality | Joseph Morelle | 2,105 | 0.8 | |
| Total | Joseph Morelle | 149,993 | 59.0 | |
| Republican | Jim Maxwell | 91,342 | 33.8 | |
| Conservative | Jim Maxwell | 17,781 | 6.6 | |
| Reform | Jim Maxwell | 1,613 | 0.6 | |
| Total | Jim Maxwell | 105,925 | 41.0 | |
| Total votes | 269,980 | 100.0 | ||
| Democratic hold | ||||
| Party | Candidate | Votes | % | |
|---|---|---|---|---|
| Democratic | Joseph Morelle | 187,503 | 53.9 | |
| Working Families | Joseph Morelle | 14,584 | 4.2 | |
| Independence | Joseph Morelle | 4,309 | 1.2 | |
| Total | Joseph Morelle (incumbent) | 206,396 | 59.3 | |
| Republican | George Mitris | 115,940 | 33.4 | |
| Conservative | George Mitris | 20,258 | 5.8 | |
| Total | George Mitris | 136,198 | 39.2 | |
| Libertarian | Kevin Wilson | 5,325 | 1.5 | |
| Total votes | 347,919 | 100.0 | ||
| Democratic hold | ||||
See also
References
- ↑ "My Congressional District".
- ↑ "2022 Cook PVI: District Map and List". Cook Political Report. Retrieved January 10, 2023.
- ↑ Joseph Morelle bio https://ballotpedia.org/Joseph_Morelle
- ↑ James Maxwell bio https://ballotpedia.org/James_Maxwell_(New_York)
- ↑ "New York's 25th Congressional District election, 2018". ballotpedia.org. Ballotpedia. Retrieved January 24, 2020.
- ↑ "November 3, 2020 General Election Certification" (PDF). New York State Board of Elections. September 17, 2020. Retrieved September 25, 2020.
- ↑ "2020 Election Results". New York State Board of Elections. Retrieved December 3, 2020.
- Martis, Kenneth C. (1989). The Historical Atlas of Political Parties in the United States Congress. New York: Macmillan Publishing Company.
- Martis, Kenneth C. (1982). The Historical Atlas of United States Congressional Districts. New York: Macmillan Publishing Company.
- Congressional Biographical Directory of the United States 1774–present
- 2004 House election data Clerk of the House of Representatives
- 2002 House election data "
- 2000 House election data "
- 1998 House election data "
- 1996 House election data "
.svg.png.webp)
.jpg.webp)
.jpg.webp)



.jpg.webp)






.tif.png.webp)
.jpg.webp)
_(since_2023).svg.png.webp)