| Nebraska's 1st congressional district | |||
|---|---|---|---|
.png.webp) Nebraska's 1st congressional district (from 2023) | |||
| Representative |
| ||
| Distribution |
| ||
| Population (2022) | 659,903 | ||
| Median household income | $74,193[1] | ||
| Ethnicity |
| ||
| Cook PVI | R+9[2] | ||
Nebraska's 1st congressional district is a congressional district in the U.S. state of Nebraska that encompasses most of its eastern quarter, except for Omaha and some of its suburbs, which are part of the 2nd congressional district. It includes the state capital Lincoln, as well as the cities of Bellevue, Fremont, and Norfolk. Following the 2010 United States census, the 1st congressional district was changed to include an eastern section of Sarpy County; Dakota County was moved to the 3rd congressional district.
Under the lines of redistricting following the 2010 census, The Cook Partisan Voting Index (CPVI) for the 1st congressional district was R+11.[3] However, in 2022, the CPVI adjusted the district's rating to R+9, as a result of redistricting.[4]
Recent results in statewide elections
| Year | Office | Results |
|---|---|---|
| 1992 | President | George H.W. Bush 43% – Bill Clinton 29% |
| 1996 | President | Bob Dole 50% – Bill Clinton 38% |
| 2000 | President | George W. Bush 59% – Al Gore 36% |
| 2004 | President | George W. Bush 63% – John Kerry 36% |
| 2008 | President | John McCain 54% – Barack Obama 44% |
| 2012 | President | Mitt Romney 57% – Barack Obama 41% |
| 2016 | President | Donald Trump 58% – Hillary Clinton 36% |
| 2020 | President | Donald Trump 56% – Joe Biden 41% |
| 2022 | Governor | Pillen 56% – Carol Blood 41% |
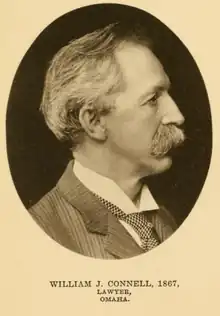
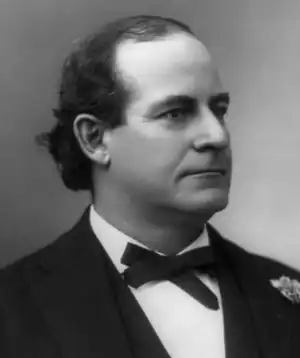
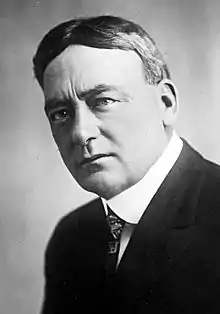
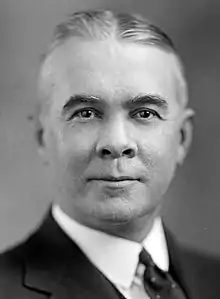
List of members representing the district
.jpg.webp)
.jpg.webp)
.jpg.webp)

.jpg.webp)

.jpg.webp)
.jpg.webp)
.jpg.webp)
.jpg.webp)

.jpg.webp)
.jpg.webp)


Election history
2002
| Party | Candidate | Votes | % | ±% | |
|---|---|---|---|---|---|
| Republican | Doug Bereuter (incumbent) | 133,013 | 85.35% | +19.10 | |
| Libertarian | Robert Eckerson | 22,831 | 14.65% | +12.03 | |
| Total votes | 155,844 | 100.0% | |||
| Republican hold | |||||
2004
| Party | Candidate | Votes | % | ±% | |
|---|---|---|---|---|---|
| Republican | Jeff Fortenberry | 143,756 | 54.23% | –31.12 | |
| Democratic | Matt Connealy | 113,971 | 43.00% | N/A | |
| Green | Steve Larrick | 7,345 | 2.77% | N/A | |
| Total votes | 265,072 | 100.0% | |||
| Republican hold | |||||
2006
| Party | Candidate | Votes | % | ±% | |
|---|---|---|---|---|---|
| Republican | Jeff Fortenberry (incumbent) | 121,015 | 58.36% | +4.13 | |
| Democratic | Maxine Moul | 86,360 | 41.64% | –1.36 | |
| Total votes | 207,375 | 100.0% | |||
| Republican hold | |||||
2008
| Party | Candidate | Votes | % | ±% | |
|---|---|---|---|---|---|
| Republican | Jeff Fortenberry (incumbent) | 184,923 | 70.36% | +12.00 | |
| Democratic | Max Yashirin | 77,897 | 29.64% | –12.00 | |
| Total votes | 262,820 | 100.0% | |||
| Republican hold | |||||
2010
| Party | Candidate | Votes | % | ±% | |
|---|---|---|---|---|---|
| Republican | Jeff Fortenberry (incumbent) | 116,871 | 71.27% | +0.91 | |
| Democratic | Ivy Harper | 47,106 | 28.73% | –0.91 | |
| Total votes | 163,977 | 100.0% | |||
| Republican hold | |||||
2012
| Party | Candidate | Votes | % | ±% | |
|---|---|---|---|---|---|
| Republican | Jeff Fortenberry (incumbent) | 174,889 | 68.29% | –2.98 | |
| Democratic | Korey L. Reiman | 81,206 | 31.71% | +2.98 | |
| Total votes | 256,095 | 100.0% | |||
| Republican hold | |||||
2014
| Party | Candidate | Votes | % | ±% | |
|---|---|---|---|---|---|
| Republican | Jeff Fortenberry (incumbent) | 123,219 | 68.82% | +0.53 | |
| Democratic | Dennis Crawford | 55,838 | 31.18% | –0.53 | |
| Total votes | 179,057 | 100.0% | |||
| Republican hold | |||||
2016
| Party | Candidate | Votes | % | ±% | |
|---|---|---|---|---|---|
| Republican | Jeff Fortenberry (incumbent) | 189,771 | 69.45% | +0.63 | |
| Democratic | Daniel M. Wik | 83,467 | 30.55% | –0.63 | |
| Total votes | 273,238 | 100.0% | |||
| Republican hold | |||||
2018
| Party | Candidate | Votes | % | ±% | |
|---|---|---|---|---|---|
| Republican | Jeff Fortenberry (incumbent) | 141,172 | 60.36% | –9.09 | |
| Democratic | Jessica McClure | 93,069 | 39.64% | +9.09 | |
| Total votes | 234,241 | 100.0% | |||
| Republican hold | |||||
2020
| Party | Candidate | Votes | % | ±% | |
|---|---|---|---|---|---|
| Republican | Jeff Fortenberry (incumbent) | 189,006 | 59.52% | –0.84 | |
| Democratic | Kate Bolz | 119,622 | 37.67% | –1.97 | |
| Libertarian | Dennis B. Grace | 8,938 | 2.81% | N/A | |
| Total votes | 317,566 | 100.0 | |||
| Republican hold | |||||
2022 (special)
| Party | Candidate | Votes | % | ±% | |
|---|---|---|---|---|---|
| Republican | Mike Flood | 61,017 | 52.69% | –6.83 | |
| Democratic | Patty Pansing Brooks | 54,783 | 47.31% | +9.64 | |
| Total votes | 115,800 | 100.0 | |||
| Republican hold | |||||
2022
| Party | Candidate | Votes | % | |
|---|---|---|---|---|
| Republican | Mike Flood (incumbent) | 129,236 | 57.91% | |
| Democratic | Patty Pansing Brooks | 93,929 | 42.09% | |
| Total votes | 223,165 | 100% | ||
| Republican hold | ||||
Historical district boundaries
.tif.png.webp)
See also
References
- ↑ "My Congressional District".
- ↑ "2022 Cook PVI: District Map and List". The Cook Political Report with Amy Walter. July 12, 2022. Retrieved July 20, 2022.
- ↑ "Partisan Voting Index – Districts of the 115th Congress" (PDF). The Cook Political Report. April 7, 2017. Retrieved April 7, 2017.
- ↑ "MIKE FLOOD WINS NEBRASKA CONGRESSIONAL SEAT". kscj.com. Retrieved June 29, 2022.
- ↑ Evnen, Robert B. (November 8, 2022). 2022 General Canvass Book (PDF). Nebraska Secretary of State. p. 11. Retrieved December 14, 2022.
- Martis, Kenneth C. (1989). The Historical Atlas of Political Parties in the United States Congress. New York: Macmillan Publishing Company.
- Martis, Kenneth C. (1982). The Historical Atlas of United States Congressional Districts. New York: Macmillan Publishing Company.
- Congressional Biographical Directory of the United States 1774–present