|
Queensland state election, 13 June 1998[1][2] | ||||||
|---|---|---|---|---|---|---|
| Enrolled voters | 2,115,977 | |||||
| Votes cast | 1,964,778 | Turnout | 92.85 | +1.42 | ||
| Informal votes | 28,438 | Informal | 1.45 | –0.30 | ||
| Summary of votes by party | ||||||
| Party | Primary votes | % | Swing | Seats | Change | |
| Labor | 773,585 | 38.86 | –4.03 | 44 | ± 0 | |
| One Nation | 439,121 | 22.68 | +22.68 | 11 | +11 | |
| Liberal | 311,514 | 16.09 | –6.65 | 9 | – 5 | |
| National | 293,839 | 15.17 | –11.08 | 23 | – 7 | |
| Greens | 45,709 | 2.36 | –0.51 | 0 | ± 0 | |
| Democrats | 31,119 | 1.61 | +0.36 | 0 | ± 0 | |
| Australia First | 9,560 | 0.49 | +0.49 | 0 | ± 0 | |
| Reform | 7,658 | 0.40 | +0.40 | 0 | ± 0 | |
| Christian Democrats | 2,098 | 0.11 | 0 | ± 0 | ||
| Shooters | 1,058 | 0.05 | +0.05 | 0 | ± 0 | |
| Women's Party | 299 | 0.01 | +0.01 | 0 | ± 0 | |
| Independent | 41,991 | 2.17 | –1.30 | 2 | + 1 | |
| Total | 1,936,340 | 89 | ||||
This is a list of electoral district results for the 1998 Queensland state election.
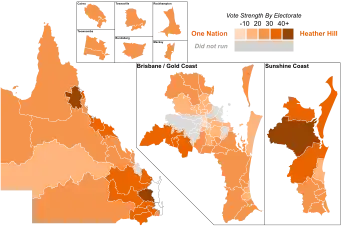
Percentage of first preference votes for One Nation in each electorate in the 1998 Queensland state election.
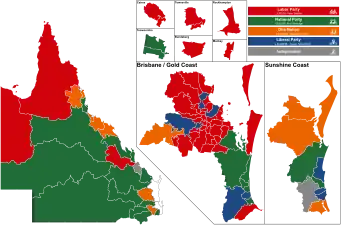
Winning party by electorate.
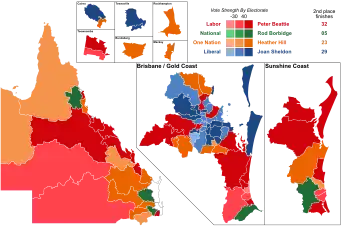
Candidates finishing in second place on a two-candidate-preferred basis (after full distribution of preferences) in each electorate.
Results by electoral district
Albert
| Party | Candidate | Votes | % | ±% | |
|---|---|---|---|---|---|
| National | Bill Baumann | 9,920 | 33.8 | -14.2 | |
| Labor | Peter Shooter | 9,772 | 33.3 | -6.3 | |
| One Nation | Rod Evans | 7,909 | 26.9 | +26.9 | |
| Greens | Sally Spain | 1,472 | 5.0 | -1.2 | |
| Reform | Lyn Green | 305 | 1.0 | +1.0 | |
| Total formal votes | 29,378 | 98.3 | +0.2 | ||
| Informal votes | 519 | 1.7 | -0.2 | ||
| Turnout | 29,897 | 91.7 | |||
| Two-party-preferred result | |||||
| National | Bill Baumann | 14,500 | 54.8 | +0.9 | |
| Labor | Peter Shooter | 11,943 | 45.2 | -0.9 | |
| National hold | Swing | +0.9 | |||
Archerfield
| Party | Candidate | Votes | % | ±% | |
|---|---|---|---|---|---|
| Labor | Karen Struthers | 12,453 | 49.54 | -6.57 | |
| Liberal | Fazal Deen | 6,112 | 24.31 | -19.58 | |
| One Nation | Rodger Pryor | 5,251 | 20.89 | +20.89 | |
| Greens | Rocco De Pierri | 826 | 3.29 | +3.29 | |
| Reform | Allen Hrstich | 497 | 1.98 | +1.98 | |
| Total formal votes | 25,139 | 98.33 | +0.65 | ||
| Informal votes | 426 | 1.67 | -0.65 | ||
| Turnout | 25,565 | 94.01 | +1.75 | ||
| Two-party-preferred result | |||||
| Labor | Karen Struthers | 14,278 | 61.71 | +5.60 | |
| Liberal | Fazal Deen | 8,860 | 38.29 | -5.60 | |
| Labor hold | Swing | +5.60 | |||
Ashgrove
| Party | Candidate | Votes | % | ±% | |
|---|---|---|---|---|---|
| Labor | Jim Fouras | 9,688 | 48.4 | +3.9 | |
| Liberal | Alan Sherlock | 7,650 | 38.2 | -5.1 | |
| Australia First | Ray Sargent | 1,044 | 5.2 | +3.9 | |
| Greens | Brenda Mason | 1,028 | 5.1 | +5.1 | |
| Democrats | Justin Yeend | 593 | 3.0 | -4.7 | |
| Total formal votes | 20,003 | 98.7 | +0.2 | ||
| Informal votes | 269 | 1.3 | -0.2 | ||
| Turnout | 20,272 | 92.8 | |||
| Two-party-preferred result | |||||
| Labor | Jim Fouras | 10,873 | 56.1 | +4.8 | |
| Liberal | Alan Sherlock | 8,509 | 43.9 | -4.8 | |
| Labor hold | Swing | +4.8 | |||
Aspley
| Party | Candidate | Votes | % | ±% | |
|---|---|---|---|---|---|
| Liberal | John Goss | 9,801 | 39.8 | -11.9 | |
| Labor | Steve Davey | 9,732 | 39.5 | +0.8 | |
| One Nation | Ron Eaton | 3,763 | 15.3 | +15.3 | |
| Greens | Alison Green | 712 | 2.9 | +2.9 | |
| Democrats | Bruce Kent | 514 | 2.1 | -3.9 | |
| Reform | Tony Argent | 124 | 0.5 | +0.5 | |
| Total formal votes | 24,646 | 98.8 | +0.3 | ||
| Informal votes | 304 | 1.2 | -0.3 | ||
| Turnout | 24,950 | 93.8 | |||
| Two-party-preferred result | |||||
| Liberal | John Goss | 11,923 | 51.8 | -5.1 | |
| Labor | Steve Davey | 11,106 | 48.2 | +5.1 | |
| Liberal hold | Swing | -5.1 | |||
Barambah
| Party | Candidate | Votes | % | ±% | |
|---|---|---|---|---|---|
| One Nation | Dorothy Pratt | 9,464 | 43.54 | +43.54 | |
| National | Trevor Perrett | 6,731 | 30.96 | -36.25 | |
| Labor | Michael Crook | 3,794 | 17.45 | -6.09 | |
| Australia First | Rod Morgan | 1,100 | 5.06 | +5.06 | |
| Independent | Steve Jeffery | 491 | 2.26 | +2.26 | |
| Independent | Peter Hayden | 158 | 0.73 | +0.73 | |
| Total formal votes | 21,738 | 98.73 | +0.22 | ||
| Informal votes | 280 | 1.27 | -0.22 | ||
| Turnout | 22,018 | 94.68 | +1.24 | ||
| Two-candidate-preferred result | |||||
| One Nation | Dorothy Pratt | 11,025 | 55.85 | +55.85 | |
| National | Trevor Perrett | 8,715 | 44.15 | -30.25 | |
| One Nation gain from National | Swing | +55.85 | |||
Barron River
| Party | Candidate | Votes | % | ±% | |
|---|---|---|---|---|---|
| Labor | Lesley Clark | 7,118 | 35.2 | -3.1 | |
| Liberal | Lyn Warwick | 6,050 | 29.9 | +3.8 | |
| One Nation | Peter Starr | 5,457 | 27.0 | +27.0 | |
| Greens | Denis Walls | 1,037 | 5.1 | -5.3 | |
| Democrats | Lisa Golding | 313 | 1.5 | -0.7 | |
| Independent | Steve Dimitriou | 270 | 1.3 | +0.0 | |
| Total formal votes | 20,245 | 98.9 | +0.3 | ||
| Informal votes | 235 | 1.1 | -0.3 | ||
| Turnout | 235 | 90.9 | |||
| Two-party-preferred result | |||||
| Labor | Lesley Clark | 9,287 | 50.6 | +1.0 | |
| Liberal | Lyn Warwick | 9,057 | 49.4 | -1.0 | |
| Labor gain from Liberal | Swing | +1.0 | |||
Beaudesert
| Party | Candidate | Votes | % | ±% | |
|---|---|---|---|---|---|
| National | Kev Lingard | 7,766 | 32.9 | -23.3 | |
| Labor | Michael De Lacy | 7,388 | 31.3 | -5.4 | |
| One Nation | Gordon Wadsworth | 6,464 | 27.4 | +27.4 | |
| Australia First | Nick Duke | 780 | 3.3 | +3.3 | |
| Greens | Bill Livermore | 721 | 3.1 | +3.1 | |
| Reform | Don Green | 202 | 0.9 | +0.9 | |
| Shooters | Vin McNamara | 148 | 0.6 | +0.6 | |
| Independent | Ian Dillon | 122 | 0.5 | +0.5 | |
| Total formal votes | 23,591 | 98.4 | -0.1 | ||
| Informal votes | 381 | 1.6 | +0.1 | ||
| Turnout | 23,972 | 93.8 | +1.7 | ||
| Two-party-preferred result | |||||
| National | Kev Lingard | 10,734 | 54.1 | -5.4 | |
| Labor | Michael De Lacy | 9,111 | 45.9 | +5.4 | |
| National hold | Swing | -5.4 | |||
Brisbane Central
| Party | Candidate | Votes | % | ±% | |
|---|---|---|---|---|---|
| Labor | Peter Beattie | 10,632 | 53.7 | +3.7 | |
| Liberal | Tony Gleeson | 5,179 | 26.2 | -9.4 | |
| One Nation | John Beattie | 1,925 | 9.7 | +9.7 | |
| Greens | Richard Nielsen | 932 | 4.7 | -4.7 | |
| Democrats | Nicky Jones | 783 | 4.0 | +4.0 | |
| Independent | Graham Matthews | 351 | 1.8 | +1.8 | |
| Total formal votes | 19,802 | 98.5 | +0.5 | ||
| Informal votes | 308 | 1.5 | -0.5 | ||
| Turnout | 20,110 | 89.3 | +2.0 | ||
| Two-party-preferred result | |||||
| Labor | Peter Beattie | 12,241 | 65.1 | +4.9 | |
| Liberal | Tony Gleeson | 6,549 | 34.9 | -4.9 | |
| Labor hold | Swing | +4.9 | |||
Broadwater
| Party | Candidate | Votes | % | ±% | |
|---|---|---|---|---|---|
| National | Allan Grice | 8,756 | 39.5 | -21.7 | |
| Labor | Bob Brown | 6,650 | 30.0 | -8.8 | |
| One Nation | Rosita Petch | 5,802 | 26.2 | +26.2 | |
| Greens | Marie Robb | 956 | 4.3 | +4.3 | |
| Total formal votes | 22,164 | 98.3 | +0.2 | ||
| Informal votes | 394 | 1.7 | -0.2 | ||
| Turnout | 22,558 | 90.4 | +1.5 | ||
| Two-party-preferred result | |||||
| National | Allan Grice | 11,489 | 59.8 | -1.4 | |
| Labor | Bob Brown | 7,733 | 40.2 | +1.4 | |
| National hold | Swing | -1.4 | |||
Bulimba
| Party | Candidate | Votes | % | ±% | |
|---|---|---|---|---|---|
| Labor | Pat Purcell | 11,787 | 56.8 | +0.9 | |
| Liberal | Marjorie Threapleton | 4,393 | 21.2 | -11.5 | |
| One Nation | Nigel Gibson | 3,066 | 14.8 | +14.8 | |
| Greens | Greg George | 942 | 4.5 | -7.0 | |
| Democrats | Mark Ault | 494 | 2.4 | +2.4 | |
| Reform | Wayne Jenkins | 84 | 0.4 | +0.4 | |
| Total formal votes | 20,766 | 98.5 | +0.4 | ||
| Informal votes | 316 | 1.5 | -0.4 | ||
| Turnout | 21,082 | 92.6 | +1.3 | ||
| Two-party-preferred result | |||||
| Labor | Pat Purcell | 13,514 | 69.5 | +6.9 | |
| Liberal | Marjorie Threapleton | 5,929 | 30.5 | -6.9 | |
| Labor hold | Swing | +6.9 | |||
Bundaberg
| Party | Candidate | Votes | % | ±% | |
|---|---|---|---|---|---|
| Labor | Nita Cunningham | 8,801 | 44.4 | -6.1 | |
| One Nation | Bernard Barry | 5,819 | 29.3 | +29.3 | |
| National | David Porter | 4,709 | 23.7 | -25.7 | |
| Greens | Ray Pearce | 303 | 1.5 | +1.5 | |
| Democrats | Lance Hall | 198 | 1.0 | +1.0 | |
| Total formal votes | 19,830 | 98.9 | +0.4 | ||
| Informal votes | 213 | 1.1 | -0.4 | ||
| Turnout | 20,043 | 93.5 | +0.9 | ||
| Two-candidate-preferred result | |||||
| Labor | Nita Cunningham | 9,743 | 52.0 | +1.5 | |
| One Nation | Bernard Barry | 8,979 | 48.0 | +48.0 | |
| Labor hold | Swing | +1.5 | |||
Bundamba
| Party | Candidate | Votes | % | ±% | |
|---|---|---|---|---|---|
| Labor | Bob Gibbs | 10,030 | 48.2 | -10.0 | |
| One Nation | Colene Hughes | 7,135 | 34.3 | +34.3 | |
| Liberal | Jeff Matijasevic | 2,472 | 11.9 | -12.6 | |
| Greens | John McKeon | 614 | 2.9 | +2.9 | |
| Democrats | Andre Klingbeil | 577 | 2.8 | +2.8 | |
| Total formal votes | 20,828 | 98.3 | +1.4 | ||
| Informal votes | 358 | 1.7 | -1.4 | ||
| Turnout | 21,186 | 92.9 | +1.9 | ||
| Two-candidate-preferred result | |||||
| Labor | Bob Gibbs | 11,213 | 56.2 | -8.6 | |
| One Nation | Colene Hughes | 8,733 | 43.8 | +43.8 | |
| Labor hold | Swing | -8.6 | |||
Burdekin
| Party | Candidate | Votes | % | ±% | |
|---|---|---|---|---|---|
| One Nation | Jeff Knuth | 7,657 | 33.1 | +33.1 | |
| Labor | Les Walker | 7,307 | 31.6 | -5.9 | |
| National | Terry Morato | 6,693 | 28.9 | -29.0 | |
| Australia First | Elaine Steley | 963 | 4.2 | +4.2 | |
| Democrats | Maurie Nichols | 535 | 2.3 | +2.3 | |
| Total formal votes | 23,155 | 98.7 | +0.3 | ||
| Informal votes | 296 | 1.3 | -0.3 | ||
| Turnout | 23,451 | 93.8 | +2.1 | ||
| Two-candidate-preferred result | |||||
| One Nation | Jeff Knuth | 12,725 | 59.4 | +59.4 | |
| Labor | Les Walker | 8,692 | 40.6 | +1.2 | |
| One Nation gain from National | Swing | +59.4 | |||
Burleigh
| Party | Candidate | Votes | % | ±% | |
|---|---|---|---|---|---|
| National | Judy Gamin | 8,431 | 41.3 | -12.5 | |
| Labor | Michael Lennon | 6,581 | 32.2 | -7.7 | |
| One Nation | Terry Sharples | 4,403 | 21.6 | +21.6 | |
| Greens | David Byerlee | 995 | 4.9 | +4.9 | |
| Total formal votes | 20,410 | 98.4 | +0.1 | ||
| Informal votes | 329 | 1.6 | -0.1 | ||
| Turnout | 20,739 | 91.1 | +1.2 | ||
| Two-party-preferred result | |||||
| National | Judy Gamin | 11,088 | 58.5 | +1.1 | |
| Labor | Michael Lennon | 7,882 | 41.5 | -1.1 | |
| National hold | Swing | +1.1 | |||
Burnett
| Party | Candidate | Votes | % | ±% | |
|---|---|---|---|---|---|
| One Nation | Glen Onoprienko | 10,076 | 36.4 | +36.4 | |
| National | Doug Slack | 8,993 | 32.5 | -28.6 | |
| Labor | Greg McMahon | 7,607 | 27.5 | -11.4 | |
| Greens | Christine Kret | 786 | 2.8 | +2.8 | |
| Independent | Richard Smith | 201 | 0.7 | +0.7 | |
| Total formal votes | 27,663 | 98.9 | +0.4 | ||
| Informal votes | 312 | 1.1 | -0.4 | ||
| Turnout | 27,975 | 94.0 | +0.6 | ||
| Two-candidate-preferred result | |||||
| National | Doug Slack | 12,648 | 52.3 | -8.8 | |
| One Nation | Glen Onoprienko | 11,521 | 47.7 | +47.7 | |
| National hold | Swing | -8.8 | |||
Caboolture
| Party | Candidate | Votes | % | ±% | |
|---|---|---|---|---|---|
| Labor | Jon Sullivan | 10,471 | 39.14 | -8.28 | |
| One Nation | Bill Feldman | 8,008 | 29.93 | +29.93 | |
| National | Peter Lacey | 6,222 | 23.26 | -20.11 | |
| Independent | Bill Newton | 1,331 | 4.98 | +4.98 | |
| Democrats | Liz Oss-Emer | 581 | 2.17 | -2.37 | |
| Reform | Brian O'Grady | 140 | 0.52 | +0.52 | |
| Total formal votes | 26,753 | 98.43 | -0.04 | ||
| Informal votes | 426 | 1.57 | +0.04 | ||
| Turnout | 27,179 | 93.98 | +0.29 | ||
| Two-candidate-preferred result | |||||
| One Nation | Bill Feldman | 13,245 | 52.69 | +52.69 | |
| Labor | Jon Sullivan | 11,894 | 47.31 | -4.96 | |
| One Nation gain from Labor | Swing | +52.69 | |||
Cairns
| Party | Candidate | Votes | % | ±% | |
|---|---|---|---|---|---|
| Labor | Desley Boyle | 7,186 | 39.1 | -7.8 | |
| One Nation | Peter Boniface | 5,067 | 27.5 | +27.5 | |
| Liberal | Myles Thompson | 4,318 | 23.5 | -18.3 | |
| Independent | Nev Bates | 994 | 5.4 | +5.4 | |
| Greens | Jonathan Metcalfe | 835 | 4.5 | -2.9 | |
| Total formal votes | 18,400 | 98.7 | +0.3 | ||
| Informal votes | 250 | 1.3 | -0.3 | ||
| Turnout | 18,650 | 88.5 | +4.2 | ||
| Two-candidate-preferred result | |||||
| Labor | Desley Boyle | 9,035 | 52.3 | +0.0 | |
| One Nation | Peter Boniface | 8,253 | 47.7 | +47.7 | |
| Labor hold | Swing | +0.0 | |||
Callide
| Party | Candidate | Votes | % | ±% | |
|---|---|---|---|---|---|
| National | Jeff Seeney | 6,597 | 37.7 | -36.7 | |
| One Nation | Chris Savage | 6,566 | 37.5 | +37.5 | |
| Labor | Gary Barton | 3,335 | 19.0 | -1.7 | |
| Australia First | Dolores Fowler | 1,013 | 5.8 | +5.8 | |
| Total formal votes | 17,511 | 99.0 | +0.1 | ||
| Informal votes | 175 | 1.0 | -0.1 | ||
| Turnout | 17,686 | 95.2 | +0.3 | ||
| Two-candidate-preferred result | |||||
| National | Jeff Seeney | 8,432 | 52.3 | -25.5 | |
| One Nation | Chris Savage | 7,696 | 47.7 | +47.7 | |
| National hold | Swing | -25.5 | |||
Caloundra
| Party | Candidate | Votes | % | ±% | |
|---|---|---|---|---|---|
| Liberal | Joan Sheldon | 9,625 | 40.5 | -14.3 | |
| Labor | Don Wilson | 6,680 | 28.1 | -10.0 | |
| One Nation | Bronwyn Boag | 5,930 | 24.9 | +24.9 | |
| Greens | Louise Peach | 1,086 | 4.6 | +4.6 | |
| Australia First | John Goldsworthy | 468 | 2.0 | +2.0 | |
| Total formal votes | 23,789 | 98.7 | +0.3 | ||
| Informal votes | 305 | 1.3 | -0.3 | ||
| Turnout | 24,094 | 93.2 | +0.9 | ||
| Two-party-preferred result | |||||
| Liberal | Joan Sheldon | 13,022 | 60.7 | +2.6 | |
| Labor | Don Wilson | 8,441 | 39.3 | -2.6 | |
| Liberal hold | Swing | +2.6 | |||
Capalaba
| Party | Candidate | Votes | % | ±% | |
|---|---|---|---|---|---|
| Labor | Jim Elder | 11,398 | 54.9 | -3.9 | |
| Liberal | Richard Ferrett | 5,748 | 27.7 | -13.6 | |
| Independent | David Exelby | 2,412 | 11.6 | +11.6 | |
| Greens | Julie-Anne O'Donohue | 1,215 | 5.8 | +5.8 | |
| Total formal votes | 20,773 | 97.7 | +0.0 | ||
| Informal votes | 496 | 2.3 | -0.0 | ||
| Turnout | 21,269 | 93.9 | +0.9 | ||
| Two-party-preferred result | |||||
| Labor | Jim Elder | 12,341 | 63.7 | +5.0 | |
| Liberal | Richard Ferrett | 7,027 | 36.3 | -5.0 | |
| Labor hold | Swing | +5.0 | |||
Charters Towers
| Party | Candidate | Votes | % | ±% | |
|---|---|---|---|---|---|
| Labor | Christine Scott | 5,758 | 37.1 | -2.5 | |
| National | Rob Mitchell | 5,454 | 35.2 | -20.0 | |
| One Nation | Richard O'Pray | 4,066 | 26.2 | +26.2 | |
| Shooters | Peter Salisbury | 116 | 0.8 | +0.8 | |
| Reform | Ben Dyball | 114 | 0.7 | +0.7 | |
| Total formal votes | 15,508 | 99.2 | +0.3 | ||
| Informal votes | 128 | 0.8 | -0.3 | ||
| Turnout | 15,636 | 93.2 | +0.5 | ||
| Two-party-preferred result | |||||
| National | Rob Mitchell | 7,706 | 53.7 | -4.3 | |
| Labor | Christine Scott | 6,641 | 46.3 | +4.3 | |
| National hold | Swing | -4.3 | |||
Chatsworth
| Party | Candidate | Votes | % | ±% | |
|---|---|---|---|---|---|
| Labor | Terry Mackenroth | 11,953 | 50.2 | -2.1 | |
| Liberal | Bruce Martin | 6,713 | 28.2 | -13.9 | |
| One Nation | Brian Annear-Walker | 4,015 | 16.9 | +16.9 | |
| Greens | Clare Rudkin | 1,126 | 4.7 | +4.7 | |
| Total formal votes | 23,807 | 98.3 | +0.3 | ||
| Informal votes | 400 | 1.7 | -0.3 | ||
| Turnout | 24,207 | 93.9 | +0.5 | ||
| Two-party-preferred result | |||||
| Labor | Terry Mackenroth | 13,440 | 58.7 | +4.5 | |
| Liberal | Bruce Martin | 9,455 | 41.3 | -4.5 | |
| Labor hold | Swing | +4.5 | |||
Chermside
| Party | Candidate | Votes | % | ±% | |
|---|---|---|---|---|---|
| Labor | Terry Sullivan | 9,345 | 49.89 | -1.97 | |
| Liberal | Zenia Belcher | 5,623 | 30.02 | -12.16 | |
| One Nation | Hazel Walsh | 2,905 | 15.51 | +15.51 | |
| Democrats | John Lambert | 717 | 3.83 | +3.83 | |
| Reform | Noel Otto | 141 | 0.75 | +0.75 | |
| Total formal votes | 18,731 | 98.67 | +0.19 | ||
| Informal votes | 253 | 1.33 | -0.19 | ||
| Turnout | 18,984 | 93.13 | -0.21 | ||
| Two-party-preferred result | |||||
| Labor | Terry Sullivan | 10,456 | 59.02 | +3.68 | |
| Liberal | Zenia Belcher | 7,260 | 40.98 | -3.68 | |
| Labor hold | Swing | +3.68 | |||
Clayfield
| Party | Candidate | Votes | % | ±% | |
|---|---|---|---|---|---|
| Liberal | Santo Santoro | 10,107 | 52.6 | -7.5 | |
| Labor | Liddy Clark | 7,498 | 39.0 | +5.4 | |
| Greens | Malcolm Lewis | 871 | 4.5 | +4.5 | |
| Democrats | Michael Brown | 756 | 3.9 | -2.4 | |
| Total formal votes | 19,232 | 98.3 | -0.3 | ||
| Informal votes | 331 | 1.7 | +0.3 | ||
| Turnout | 19,563 | 92.0 | +0.8 | ||
| Two-party-preferred result | |||||
| Liberal | Santo Santoro | 10,481 | 56.5 | -7.6 | |
| Labor | Liddy Clark | 8,054 | 43.5 | +7.6 | |
| Liberal hold | Swing | -7.6 | |||
Cleveland
| Party | Candidate | Votes | % | ±% | |
|---|---|---|---|---|---|
| Labor | Darryl Briskey | 10,506 | 43.7 | -3.8 | |
| Liberal | Damien Massingham | 7,391 | 30.8 | -12.7 | |
| One Nation | Bluey Bostock | 4,644 | 19.3 | +19.3 | |
| Democrats | Jenny Van Rooyen | 833 | 3.5 | -5.5 | |
| Independent | Phil Ball | 477 | 2.0 | +2.0 | |
| Reform | Barry Archie | 176 | 0.7 | +0.7 | |
| Total formal votes | 24,027 | 98.6 | +0.1 | ||
| Informal votes | 352 | 1.4 | -0.1 | ||
| Turnout | 24,379 | 93.9 | +1.5 | ||
| Two-party-preferred result | |||||
| Labor | Darryl Briskey | 12,490 | 56.4 | +4.0 | |
| Liberal | Damien Massingham | 9,648 | 43.6 | -4.0 | |
| Labor hold | Swing | +4.0 | |||
Cook
| Party | Candidate | Votes | % | ±% | |
|---|---|---|---|---|---|
| Labor | Steve Bredhauer | 8,370 | 54.6 | +2.1 | |
| One Nation | Carmel Mitchell | 3,124 | 20.4 | +20.4 | |
| National | Terry Cranwell | 2,989 | 19.5 | -16.6 | |
| Independent | Edgar Williams | 482 | 3.1 | -3.4 | |
| Reform | Smiley Burnett | 351 | 2.3 | +2.3 | |
| Total formal votes | 15,316 | 98.6 | +0.6 | ||
| Informal votes | 218 | 1.4 | -0.6 | ||
| Turnout | 15,534 | 86.8 | +3.4 | ||
| Two-candidate-preferred result | |||||
| Labor | Steve Bredhauer | 9,507 | 65.5 | +7.8 | |
| One Nation | Carmel Mitchell | 5,002 | 34.5 | +34.5 | |
| Labor hold | Swing | +7.8 | |||
Crows Nest
| Party | Candidate | Votes | % | ±% | |
|---|---|---|---|---|---|
| One Nation | David Cockburn | 9,342 | 39.50 | +39.50 | |
| National | Russell Cooper | 9,060 | 38.31 | -33.25 | |
| Labor | Fiona Bucknall | 3,908 | 16.53 | -4.67 | |
| Greens | John Langford | 704 | 2.98 | -4.26 | |
| Reform | Brenda Moloney | 635 | 2.69 | +2.69 | |
| Total formal votes | 23,649 | 99.02 | +0.16 | ||
| Informal votes | 234 | 0.98 | -0.16 | ||
| Turnout | 23,883 | 94.83 | +1.08 | ||
| Two-candidate-preferred result | |||||
| National | Russell Cooper | 10,940 | 50.88 | -24.67 | |
| One Nation | David Cockburn | 10,563 | 49.12 | +49.12 | |
| National hold | Swing | -24.67 | |||
Cunningham
| Party | Candidate | Votes | % | ±% | |
|---|---|---|---|---|---|
| National | Tony Elliott | 10,384 | 43.2 | -30.6 | |
| One Nation | Sherry Passfield | 7,774 | 32.4 | +32.4 | |
| Labor | Jackie Trad | 4,535 | 18.9 | -7.3 | |
| Independent | Ken Davies | 605 | 2.5 | +2.5 | |
| Independent | Anne Smeaton | 399 | 1.7 | +1.7 | |
| Reform | Bill Ison | 324 | 1.4 | +1.4 | |
| Total formal votes | 24,021 | 98.8 | +0.6 | ||
| Informal votes | 301 | 1.2 | -0.6 | ||
| Turnout | 24,322 | 93.7 | +1.3 | ||
| Two-candidate-preferred result | |||||
| National | Tony Elliott | 12,507 | 58.8 | -15.0 | |
| One Nation | Sherry Passfield | 8,744 | 41.2 | +41.2 | |
| National hold | Swing | -15.0 | |||
Currumbin
| Party | Candidate | Votes | % | ±% | |
|---|---|---|---|---|---|
| Labor | Merri Rose | 8,982 | 40.6 | -5.7 | |
| One Nation | Paul Boyle | 4,537 | 20.5 | +20.5 | |
| National | Sue Robbins | 4,475 | 20.2 | +20.2 | |
| Liberal | Warrick Coleborne | 3,155 | 14.3 | -30.9 | |
| Greens | John Palmer | 898 | 4.1 | -3.4 | |
| Independent | Mick Gay | 56 | 0.3 | +0.3 | |
| Total formal votes | 22,103 | 98.6 | +0.0 | ||
| Informal votes | 308 | 1.4 | -0.0 | ||
| Turnout | 22,411 | 91.9 | +1.6 | ||
| Two-party-preferred result | |||||
| Labor | Merri Rose | 10,683 | 52.8 | +1.2 | |
| National | Sue Robbins | 9,558 | 47.2 | +47.2 | |
| Labor hold | Swing | +1.2 | |||
Everton
| Party | Candidate | Votes | % | ±% | |
|---|---|---|---|---|---|
| Labor | Rod Welford | 10,686 | 47.2 | -3.7 | |
| Liberal | Karen Jones | 7,329 | 32.4 | -16.6 | |
| One Nation | Ken Brady | 3,481 | 15.4 | +15.4 | |
| Democrats | Brett Matthews | 1,120 | 5.0 | +5.0 | |
| Total formal votes | 22,616 | 98.8 | +0.6 | ||
| Informal votes | 269 | 1.2 | -0.6 | ||
| Turnout | 22,885 | 94.6 | +0.6 | ||
| Two-party-preferred result | |||||
| Labor | Rod Welford | 12,194 | 56.0 | +5.0 | |
| Liberal | Karen Jones | 9,585 | 44.0 | -5.0 | |
| Labor hold | Swing | +5.0 | |||
Ferny Grove
| Party | Candidate | Votes | % | ±% | |
|---|---|---|---|---|---|
| Labor | Geoff Wilson | 11,049 | 45.0 | -0.9 | |
| Liberal | Ashley Manicaros | 6,955 | 28.3 | -12.1 | |
| One Nation | Kevin John | 4,333 | 17.6 | +17.6 | |
| Democrats | Suzanne Lawson | 1,224 | 5.0 | +5.0 | |
| Greens | Mark Taylor | 989 | 4.0 | -5.3 | |
| Total formal votes | 24,550 | 98.8 | +0.3 | ||
| Informal votes | 289 | 1.2 | -0.3 | ||
| Turnout | 24,839 | 94.7 | +0.8 | ||
| Two-party-preferred result | |||||
| Labor | Geoff Wilson | 13,407 | 58.6 | +5.3 | |
| Liberal | Ashley Manicaros | 9,480 | 41.4 | -5.3 | |
| Labor hold | Swing | +5.3 | |||
Fitzroy
| Party | Candidate | Votes | % | ±% | |
|---|---|---|---|---|---|
| Labor | Jim Pearce | 10,214 | 52.2 | -4.4 | |
| One Nation | Joan Wilson | 4,402 | 22.5 | +22.5 | |
| National | Richie Bills | 4,069 | 20.8 | -22.6 | |
| Australia First | Christopher Chatham | 641 | 3.3 | +3.3 | |
| Democrats | Peter Cvetko-Lueger | 241 | 1.2 | +1.2 | |
| Total formal votes | 19,567 | 99.2 | +0.6 | ||
| Informal votes | 161 | 0.8 | -0.6 | ||
| Turnout | 19,728 | 93.9 | +1.8 | ||
| Two-candidate-preferred result | |||||
| Labor | Jim Pearce | 11,276 | 60.7 | +4.1 | |
| One Nation | Joan Wilson | 7,295 | 39.3 | +39.3 | |
| Labor hold | Swing | +4.1 | |||
Gladstone
| Party | Candidate | Votes | % | ±% | |
|---|---|---|---|---|---|
| Labor | Leo Zussino | 10,897 | 47.4 | +3.8 | |
| Independent | Liz Cunningham | 10,812 | 47.0 | +7.0 | |
| National | Paul Ford | 1,271 | 5.5 | -6.9 | |
| Total formal votes | 22,980 | 98.9 | +0.2 | ||
| Informal votes | 258 | 1.1 | -0.2 | ||
| Turnout | 23,238 | 94.4 | +1.4 | ||
| Two-candidate-preferred result | |||||
| Independent | Liz Cunningham | 11,691 | 51.4 | -1.7 | |
| Labor | Leo Zussino | 11,071 | 48.6 | +1.7 | |
| Independent hold | Swing | -1.7 | |||
Greenslopes
| Party | Candidate | Votes | % | ±% | |
|---|---|---|---|---|---|
| Labor | Gary Fenlon | 9,382 | 47.9 | -2.0 | |
| Liberal | Ted Radke | 7,902 | 40.3 | -9.8 | |
| Greens | Libby Connors | 901 | 4.6 | +4.6 | |
| Democrats | John Cherry | 586 | 3.0 | +3.0 | |
| Independent | Nigel Freemarijuana | 354 | 1.8 | +1.8 | |
| Women's Party | Jenny Hughey | 299 | 1.5 | +1.5 | |
| Reform | Paul Feeney | 167 | 0.9 | +0.9 | |
| Total formal votes | 19,591 | 98.6 | +0.7 | ||
| Informal votes | 283 | 1.4 | -0.7 | ||
| Turnout | 19,874 | 92.9 | +0.6 | ||
| Two-party-preferred result | |||||
| Labor | Gary Fenlon | 10,498 | 55.2 | +5.3 | |
| Liberal | Ted Radke | 8,530 | 44.8 | -5.3 | |
| Labor gain from Liberal | Swing | +5.3 | |||
Gregory
| Party | Candidate | Votes | % | ±% | |
|---|---|---|---|---|---|
| National | Vaughan Johnson | 6,873 | 46.7 | -22.2 | |
| Labor | Donna O'Donoghue | 4,228 | 28.7 | -2.4 | |
| One Nation | Allan Bahr | 2,554 | 17.4 | +17.4 | |
| Australia First | Ron Crozier | 640 | 4.4 | +4.4 | |
| Democrats | Rebecca Hack | 303 | 2.1 | +2.1 | |
| Shooters | Frank Taylor | 110 | 0.7 | +0.7 | |
| Total formal votes | 14,708 | 99.0 | +0.5 | ||
| Informal votes | 142 | 1.0 | -0.5 | ||
| Turnout | 14,850 | 93.9 | +1.6 | ||
| Two-party-preferred result | |||||
| National | Vaughan Johnson | 8,553 | 63.1 | -5.8 | |
| Labor | Donna O'Donoghue | 5,006 | 36.9 | +5.8 | |
| National hold | Swing | -5.8 | |||
Gympie
| Party | Candidate | Votes | % | ±% | |
|---|---|---|---|---|---|
| One Nation | Ian Petersen | 8,745 | 39.2 | +39.2 | |
| National | Len Stephan | 6,971 | 31.3 | -23.3 | |
| Labor | David Warren | 5,806 | 26.1 | -4.7 | |
| Greens | Chris Gwin | 764 | 3.4 | +3.4 | |
| Total formal votes | 22,286 | 98.7 | +0.1 | ||
| Informal votes | 284 | 1.3 | -0.1 | ||
| Turnout | 22,570 | 93.8 | +0.9 | ||
| Two-candidate-preferred result | |||||
| National | Len Stephan | 10,486 | 51.7 | -10.9 | |
| One Nation | Ian Petersen | 9,796 | 48.3 | +48.3 | |
| National hold | Swing | -10.9 | |||
Hervey Bay
| Party | Candidate | Votes | % | ±% | |
|---|---|---|---|---|---|
| Labor | Bill Nunn | 9,213 | 36.3 | -12.1 | |
| One Nation | David Dalgleish | 8,584 | 33.8 | +33.8 | |
| National | Scott McLay | 6,968 | 27.4 | -17.6 | |
| Democrats | Phil Rodhouse | 325 | 1.3 | -5.3 | |
| Greens | Bob Borsellino | 314 | 1.2 | +1.2 | |
| Total formal votes | 25,404 | 99.0 | +0.2 | ||
| Informal votes | 266 | 1.0 | -0.2 | ||
| Turnout | 25,670 | 93.8 | +1.0 | ||
| Two-candidate-preferred result | |||||
| One Nation | David Dalgleish | 13,027 | 55.3 | +55.3 | |
| Labor | Bill Nunn | 10,540 | 44.7 | -7.2 | |
| One Nation gain from Labor | Swing | +55.3 | |||
Hinchinbrook
| Party | Candidate | Votes | % | ±% | |
|---|---|---|---|---|---|
| National | Marc Rowell | 7,675 | 36.7 | -26.1 | |
| One Nation | John Wyllie | 6,172 | 29.5 | +29.5 | |
| Labor | Richard Barkas | 6,008 | 28.7 | -4.8 | |
| Australia First | Teresa Roveda | 1,078 | 5.1 | +5.1 | |
| Total formal votes | 20,933 | 98.7 | +0.2 | ||
| Informal votes | 284 | 1.3 | -0.2 | ||
| Turnout | 21,217 | 93.6 | +1.9 | ||
| Two-candidate-preferred result | |||||
| National | Marc Rowell | 10,975 | 58.6 | -6.2 | |
| One Nation | John Wyllie | 7,766 | 41.4 | +41.4 | |
| National hold | Swing | -6.2 | |||
Inala
| Party | Candidate | Votes | % | ±% | |
|---|---|---|---|---|---|
| Labor | Henry Palaszczuk | 12,748 | 67.1 | -1.8 | |
| Liberal | Philip Greenaway | 3,253 | 17.1 | -14.0 | |
| Democrats | Lin Dengate | 1,618 | 8.5 | +5.8 | |
| Greens | Lenore Taylor | 1,020 | 5.4 | +5.4 | |
| Independent | Xuan Nguyen | 373 | 2.0 | +2.0 | |
| Total formal votes | 19,012 | 96.6 | -0.4 | ||
| Informal votes | 674 | 3.4 | +0.4 | ||
| Turnout | 19,686 | 92.8 | -1.4 | ||
| Two-party-preferred result | |||||
| Labor | Henry Palaszczuk | 14,015 | 77.4 | +8.5 | |
| Liberal | Philip Greenaway | 4,094 | 22.6 | -8.5 | |
| Labor hold | Swing | +8.5 | |||
Indooroopilly
| Party | Candidate | Votes | % | ±% | |
|---|---|---|---|---|---|
| Liberal | Denver Beanland | 9,482 | 45.0 | -11.1 | |
| Labor | Anne Stuart | 7,908 | 37.6 | +9.3 | |
| Greens | Drew Hutton | 2,049 | 9.7 | +0.8 | |
| Democrats | Mary McIntyre | 1,618 | 7.7 | +1.0 | |
| Total formal votes | 21,057 | 98.7 | -0.3 | ||
| Informal votes | 270 | 1.3 | +0.3 | ||
| Turnout | 21,327 | 91.1 | +0.8 | ||
| Two-party-preferred result | |||||
| Liberal | Denver Beanland | 10,412 | 50.7 | -12.6 | |
| Labor | Anne Stuart | 10,137 | 49.3 | +12.6 | |
| Liberal hold | Swing | +12.6 | |||
Ipswich
| Party | Candidate | Votes | % | ±% | |
|---|---|---|---|---|---|
| Labor | David Hamill | 9,601 | 45.8 | -5.9 | |
| One Nation | Heather Hill | 8,281 | 39.5 | +39.5 | |
| Liberal | Steve Wilson | 2,207 | 10.5 | -27.9 | |
| Greens | Desiree Mahoney | 666 | 3.2 | -4.2 | |
| Reform | Peter Morris | 194 | 0.9 | +0.9 | |
| Total formal votes | 20,949 | 98.5 | +0.5 | ||
| Informal votes | 315 | 1.5 | -0.5 | ||
| Turnout | 21,264 | 94.1 | +0.9 | ||
| Two-candidate-preferred result | |||||
| Labor | David Hamill | 10,690 | 53.4 | -3.0 | |
| One Nation | Heather Hill | 9,323 | 46.6 | +46.6 | |
| Labor hold | Swing | -3.0 | |||
Ipswich West
| Party | Candidate | Votes | % | ±% | |
|---|---|---|---|---|---|
| Labor | Don Livingstone | 9,658 | 41.9 | -8.9 | |
| One Nation | Jack Paff | 8,900 | 38.6 | +38.6 | |
| National | Sue Wykes | 4,065 | 17.6 | -17.7 | |
| Reform | Lance Schloss | 416 | 1.8 | +1.8 | |
| Total formal votes | 23,039 | 98.8 | +1.0 | ||
| Informal votes | 291 | 1.2 | -1.0 | ||
| Turnout | 23,330 | 95.0 | +1.1 | ||
| Two-candidate-preferred result | |||||
| One Nation | Jack Paff | 11,444 | 51.9 | +51.9 | |
| Labor | Don Livingstone | 10,626 | 48.1 | -7.3 | |
| One Nation gain from Labor | Swing | +51.9 | |||
Kallangur
| Party | Candidate | Votes | % | ±% | |
|---|---|---|---|---|---|
| Labor | Ken Hayward | 12,797 | 42.7 | -5.4 | |
| One Nation | Boyd Nimmo | 8,077 | 26.9 | +26.9 | |
| Liberal | Scott Driscoll | 6,583 | 22.0 | -14.3 | |
| Christian Democrats | Howard Shepherd | 1,265 | 4.2 | +4.2 | |
| Greens | Noel Hoffman | 898 | 3.0 | -6.8 | |
| Reform | Allan Taylor | 198 | 0.7 | +0.7 | |
| Independent | Peter Birt | 166 | 0.6 | +0.6 | |
| Total formal votes | 29,984 | 98.3 | +0.5 | ||
| Informal votes | 528 | 1.7 | -0.5 | ||
| Turnout | 30,512 | 93.7 | +0.9 | ||
| Two-candidate-preferred result | |||||
| Labor | Ken Hayward | 14,745 | 53.9 | -0.1 | |
| One Nation | Boyd Nimmo | 12,608 | 46.1 | +46.1 | |
| Labor hold | Swing | -0.1 | |||
Kedron
| Party | Candidate | Votes | % | ±% | |
|---|---|---|---|---|---|
| Labor | Paul Braddy | 9,561 | 52.31 | -6.88 | |
| Liberal | Cynthia Harris | 4,699 | 25.71 | -15.10 | |
| One Nation | Joan Gordon | 2,661 | 14.56 | +14.56 | |
| Democrats | Elizabeth Rowland | 910 | 4.98 | +4.98 | |
| Independent | Kay Spence | 448 | 2.45 | +2.45 | |
| Total formal votes | 18,279 | 98.34 | +1.13 | ||
| Informal votes | 308 | 1.66 | -1.13 | ||
| Turnout | 18,587 | 92.64 | +0.96 | ||
| Two-party-preferred result | |||||
| Labor | Paul Braddy | 11,003 | 64.07 | +4.88 | |
| Liberal | Cynthia Harris | 6,171 | 35.93 | -4.88 | |
| Labor hold | Swing | +4.88 | |||
Keppel
| Party | Candidate | Votes | % | ±% | |
|---|---|---|---|---|---|
| Labor | Bruce Saunders | 8,134 | 32.0 | -4.4 | |
| National | Vince Lester | 7,582 | 29.8 | -27.5 | |
| One Nation | Wendy McFarlane | 5,430 | 21.3 | +21.3 | |
| Independent | Glenda Mather | 1,679 | 6.6 | +6.6 | |
| Australia First | Rick Nagle | 1,217 | 4.8 | +4.8 | |
| Independent | Toni Hansen | 849 | 3.3 | +3.3 | |
| Democrats | Terry Clark | 546 | 2.1 | +2.1 | |
| Total formal votes | 25,437 | 98.8 | -0.1 | ||
| Informal votes | 312 | 1.2 | +0.1 | ||
| Turnout | 25,749 | 93.7 | +1.1 | ||
| Two-party-preferred result | |||||
| National | Vince Lester | 11,932 | 53.6 | -6.7 | |
| Labor | Bruce Saunders | 10,330 | 46.4 | +6.7 | |
| National hold | Swing | -6.7 | |||
Kurwongbah
| Party | Candidate | Votes | % | ±% | |
|---|---|---|---|---|---|
| Labor | Linda Lavarch | 11,857 | 49.5 | +4.5 | |
| Liberal | Justin Kerr | 5,423 | 22.6 | -9.8 | |
| One Nation | Kim Thistlethwaite | 5,312 | 22.2 | +22.2 | |
| Greens | Kim Pantano | 1,371 | 5.7 | -3.5 | |
| Total formal votes | 23,963 | 98.5 | -0.1 | ||
| Informal votes | 356 | 1.5 | +0.1 | ||
| Turnout | 24,319 | 94.8 | +1.8 | ||
| Two-party-preferred result | |||||
| Labor | Linda Lavarch | 13,847 | 63.2 | +7.3 | |
| Liberal | Justin Kerr | 8,061 | 36.8 | -7.3 | |
| Labor hold | Swing | +7.3 | |||
Lockyer
| Party | Candidate | Votes | % | ±% | |
|---|---|---|---|---|---|
| One Nation | Peter Prenzler | 9,943 | 39.2 | +39.2 | |
| National | Tony Fitzgerald | 6,473 | 25.5 | -41.1 | |
| Labor | Dan O'Brien | 5,324 | 21.0 | -5.8 | |
| Independent | Jim McDonald | 2,768 | 10.9 | +10.9 | |
| Reform | Tony Howard | 680 | 2.7 | +2.7 | |
| Shooters | Patricia Andrew | 160 | 0.6 | +0.6 | |
| Total formal votes | 25,348 | 98.8 | +0.4 | ||
| Informal votes | 296 | 1.2 | -0.4 | ||
| Turnout | 25,644 | 94.7 | +0.9 | ||
| Two-candidate-preferred result | |||||
| One Nation | Peter Prenzler | 11,742 | 53.7 | +53.7 | |
| National | Tony Fitzgerald | 10,134 | 46.3 | -24.5 | |
| One Nation gain from National | Swing | +53.7 | |||
Logan
| Party | Candidate | Votes | % | ±% | |
|---|---|---|---|---|---|
| Labor | John Mickel | 12,353 | 49.0 | -17.9 | |
| One Nation | Jan Dawson | 7,202 | 28.6 | +28.6 | |
| National | James Lister | 3,695 | 14.7 | -18.4 | |
| Independent | Russell Leneham | 1,441 | 5.7 | +5.7 | |
| Democrats | Alan Dickson | 495 | 2.0 | +2.0 | |
| Total formal votes | 25,186 | 97.8 | +0.6 | ||
| Informal votes | 563 | 2.2 | -0.6 | ||
| Turnout | 25,749 | 92.9 | +2.0 | ||
| Two-candidate-preferred result | |||||
| Labor | John Mickel | 13,903 | 58.4 | -8.5 | |
| One Nation | Jan Dawson | 9,895 | 41.6 | +41.6 | |
| Labor hold | Swing | -8.5 | |||
Lytton
| Party | Candidate | Votes | % | ±% | |
|---|---|---|---|---|---|
| Labor | Paul Lucas | 12,579 | 59.8 | +3.6 | |
| Liberal | Tony Murphy | 5,859 | 27.9 | -7.1 | |
| Democrats | Marianne Dickie | 1,385 | 6.6 | +6.6 | |
| Greens | Rob Wilson | 1,207 | 5.7 | -3.1 | |
| Total formal votes | 21,030 | 97.5 | -0.9 | ||
| Informal votes | 540 | 2.5 | +0.9 | ||
| Turnout | 21,570 | 94.3 | +1.3 | ||
| Two-party-preferred result | |||||
| Labor | Paul Lucas | 13,730 | 67.4 | +6.1 | |
| Liberal | Tony Murphy | 6,626 | 32.6 | -6.1 | |
| Labor hold | Swing | +6.1 | |||
Mackay
| Party | Candidate | Votes | % | ±% | |
|---|---|---|---|---|---|
| Labor | Tim Mulherin | 9,603 | 48.7 | -3.8 | |
| One Nation | Barry Evans | 5,323 | 27.0 | +27.0 | |
| National | Marcella Massie | 4,503 | 22.9 | -16.1 | |
| Independent | Mike Ettridge | 272 | 1.4 | +1.4 | |
| Total formal votes | 19,701 | 98.6 | +0.6 | ||
| Informal votes | 279 | 1.4 | -0.6 | ||
| Turnout | 19,980 | 93.3 | +3.3 | ||
| Two-candidate-preferred result | |||||
| Labor | Tim Mulherin | 10,536 | 56.5 | +0.9 | |
| One Nation | Barry Evans | 8,103 | 43.5 | +43.5 | |
| Labor hold | Swing | +0.9 | |||
Mansfield
| Party | Candidate | Votes | % | ±% | |
|---|---|---|---|---|---|
| Labor | Phil Reeves | 10,399 | 40.9 | +2.2 | |
| Liberal | Frank Carroll | 9,913 | 39.0 | -12.9 | |
| One Nation | Michael Harris-Gahan | 3,696 | 14.5 | +14.5 | |
| Greens | Scott Alderson | 817 | 3.2 | -6.3 | |
| Democrats | Faye Carrington | 625 | 2.5 | +2.5 | |
| Total formal votes | 25,450 | 98.8 | +0.1 | ||
| Informal votes | 311 | 1.2 | -0.1 | ||
| Turnout | 25,761 | 93.7 | +0.6 | ||
| Two-party-preferred result | |||||
| Labor | Phil Reeves | 12,205 | 50.2 | +6.9 | |
| Liberal | Frank Carroll | 12,122 | 49.8 | -6.9 | |
| Labor gain from Liberal | Swing | +6.9 | |||
Maroochydore
| Party | Candidate | Votes | % | ±% | |
|---|---|---|---|---|---|
| National | Fiona Simpson | 9,426 | 40.3 | -17.3 | |
| One Nation | Cheryl Parker | 6,443 | 27.6 | +27.6 | |
| Labor | Dan Siskind | 5,635 | 24.1 | -7.6 | |
| Greens | John Fitzgerald | 1,157 | 5.0 | -5.7 | |
| Democrats | Gaylene Bell | 709 | 3.0 | +3.0 | |
| Total formal votes | 23,370 | 98.5 | -0.1 | ||
| Informal votes | 345 | 1.5 | +0.1 | ||
| Turnout | 23,715 | 90.7 | +0.6 | ||
| Two-candidate-preferred result | |||||
| National | Fiona Simpson | 13,695 | 65.1 | +2.8 | |
| One Nation | Cheryl Parker | 7,357 | 34.9 | +34.9 | |
| National hold | Swing | +2.8 | |||
Maryborough
| Party | Candidate | Votes | % | ±% | |
|---|---|---|---|---|---|
| One Nation | John Kingston | 8,539 | 42.6 | +42.6 | |
| Labor | Bob Dollin | 7,163 | 35.7 | -10.7 | |
| National | Kev Mahoney | 3,787 | 18.9 | -26.1 | |
| Greens | Sue Russell | 576 | 2.9 | +2.9 | |
| Total formal votes | 20,065 | 98.9 | +0.2 | ||
| Informal votes | 232 | 1.1 | -0.2 | ||
| Turnout | 20,297 | 95.1 | +0.6 | ||
| Two-candidate-preferred result | |||||
| One Nation | John Kingston | 11,126 | 58.3 | +58.3 | |
| Labor | Bob Dollin | 7,950 | 41.7 | -8.7 | |
| One Nation gain from Labor | Swing | +58.3 | |||
Merrimac
The results for Merrimac were:[9]
| Party | Candidate | Votes | % | ±% | |
|---|---|---|---|---|---|
| Liberal | Bob Quinn | 11,093 | 49.1 | -16.3 | |
| Labor | Robert Poole | 6,405 | 28.4 | -6.2 | |
| One Nation | John Fairfax | 4,487 | 19.9 | +19.9 | |
| Democrats | Colin O'Brien | 601 | 2.7 | +2.7 | |
| Total formal votes | 22,586 | 98.2 | +0.4 | ||
| Informal votes | 417 | 1.8 | -0.4 | ||
| Turnout | 23,003 | 89.7 | +1.7 | ||
| Two-party-preferred result | |||||
| Liberal | Bob Quinn | 13,424 | 64.7 | -0.7 | |
| Labor | Robert Poole | 7,327 | 35.3 | +0.7 | |
| Liberal hold | Swing | -0.7 | |||
Mirani
| Party | Candidate | Votes | % | ±% | |
|---|---|---|---|---|---|
| Labor | Barry Gomersall | 8,768 | 35.6 | -3.3 | |
| National | Ted Malone | 8,145 | 33.1 | -22.9 | |
| One Nation | Edward Vaughan | 7,054 | 28.7 | +28.7 | |
| Australia First | Lawrence Hewitt | 431 | 1.8 | +1.8 | |
| Shooters | Steve Purtill | 199 | 0.8 | +0.8 | |
| Total formal votes | 24,597 | 98.9 | +0.4 | ||
| Informal votes | 265 | 1.1 | -0.4 | ||
| Turnout | 24,862 | 94.2 | +1.5 | ||
| Two-party-preferred result | |||||
| National | Ted Malone | 11,528 | 52.7 | -6.4 | |
| Labor | Barry Gomersall | 10,348 | 47.3 | +6.4 | |
| National hold | Swing | -6.4 | |||
Moggill
| Party | Candidate | Votes | % | ±% | |
|---|---|---|---|---|---|
| Liberal | David Watson | 12,202 | 53.3 | -13.7 | |
| Labor | Laurie Lumsden | 7,739 | 33.8 | +0.7 | |
| Democrats | Kirsty Fraser | 1,531 | 6.7 | +6.7 | |
| Greens | Brett Sloan | 1,436 | 6.3 | +6.3 | |
| Total formal votes | 22,908 | 98.6 | +0.4 | ||
| Informal votes | 323 | 1.4 | -0.4 | ||
| Turnout | 23,231 | 92.9 | +0.7 | ||
| Two-party-preferred result | |||||
| Liberal | David Watson | 13,117 | 58.9 | -8.0 | |
| Labor | Laurie Lumsden | 9,140 | 41.1 | +8.0 | |
| Liberal hold | Swing | -8.0 | |||
Mooloolah
The results for Moolooah were:[10]
| Party | Candidate | Votes | % | ±% | |
|---|---|---|---|---|---|
| Liberal | Bruce Laming | 12,121 | 46.7 | -17.1 | |
| Labor | Marc Zande | 6,222 | 24.0 | -2.4 | |
| One Nation | Roy Schell | 6,173 | 23.8 | +23.8 | |
| Greens | Nicholas Redmond | 1,432 | 5.5 | -3.0 | |
| Total formal votes | 25,948 | 98.6 | +0.1 | ||
| Informal votes | 363 | 1.4 | -0.1 | ||
| Turnout | 26,311 | 92.2 | +1.4 | ||
| Two-party-preferred result | |||||
| Liberal | Bruce Laming | 15,728 | 65.9 | -3.4 | |
| Labor | Marc Zande | 8,129 | 34.1 | +3.4 | |
| Liberal hold | Swing | -3.4 | |||
Mount Coot-tha
| Party | Candidate | Votes | % | ±% | |
|---|---|---|---|---|---|
| Labor | Wendy Edmond | 10,198 | 49.1 | +10.3 | |
| Liberal | Rolene Orford | 7,273 | 35.0 | -2.0 | |
| Greens | Dick Copeman | 2,107 | 10.1 | -14.1 | |
| Democrats | Alison Jensen | 1,199 | 5.8 | +5.8 | |
| Total formal votes | 20,777 | 98.6 | -0.1 | ||
| Informal votes | 294 | 1.4 | +0.1 | ||
| Turnout | 21,071 | 90.2 | +2.1 | ||
| Two-party-preferred result | |||||
| Labor | Wendy Edmond | 12,245 | 60.5 | +7.0 | |
| Liberal | Rolene Orford | 7,992 | 39.5 | -7.0 | |
| Labor hold | Swing | +7.0 | |||
Mount Gravatt
| Party | Candidate | Votes | % | ±% | |
|---|---|---|---|---|---|
| Labor | Judy Spence | 9,053 | 48.0 | -4.1 | |
| Liberal | Graham Quirk | 6,047 | 32.1 | -15.9 | |
| One Nation | Richard Duffell | 2,519 | 13.4 | +13.4 | |
| Greens | Rod Young | 720 | 3.8 | +3.8 | |
| Democrats | Ian Laing | 455 | 2.4 | +2.4 | |
| Reform | Arthur Colebrook | 76 | 0.4 | +0.4 | |
| Total formal votes | 18,870 | 98.6 | +0.7 | ||
| Informal votes | 267 | 1.4 | -0.7 | ||
| Turnout | 19,137 | 93.1 | +0.9 | ||
| Two-party-preferred result | |||||
| Labor | Judy Spence | 10,332 | 57.2 | +5.1 | |
| Liberal | Graham Quirk | 7,739 | 42.8 | -5.1 | |
| Labor hold | Swing | +5.1 | |||
Mount Isa
| Party | Candidate | Votes | % | ±% | |
|---|---|---|---|---|---|
| Labor | Tony McGrady | 7,562 | 58.5 | -6.1 | |
| One Nation | Malcolm MacDonald | 3,175 | 24.5 | +24.5 | |
| National | Bill Baldwin | 1,900 | 14.7 | -13.9 | |
| Reform | Shirleen Webber | 158 | 1.2 | +1.2 | |
| Shooters | Ian Inglis | 139 | 1.1 | +1.1 | |
| Total formal votes | 12,934 | 98.8 | +0.3 | ||
| Informal votes | 156 | 1.2 | -0.3 | ||
| Turnout | 13,090 | 89.2 | +3.9 | ||
| Two-candidate-preferred result | |||||
| Labor | Tony McGrady | 8,029 | 65.6 | -3.1 | |
| One Nation | Malcolm MacDonald | 4,207 | 34.4 | +34.4 | |
| Labor hold | Swing | -3.1 | |||
Mount Ommaney
| Party | Candidate | Votes | % | ±% | |
|---|---|---|---|---|---|
| Labor | Julie Attwood | 9,030 | 39.3 | -1.7 | |
| Liberal | Bob Harper | 8,044 | 35.0 | -11.6 | |
| One Nation | Allan Gregory | 2,777 | 12.1 | +12.1 | |
| Independent | Peter Pyke | 1,692 | 7.4 | +7.4 | |
| Greens | Helen King | 785 | 3.4 | -4.1 | |
| Democrats | Natalia Infield | 456 | 2.0 | -2.3 | |
| Independent | John Tiplady | 193 | 0.8 | +0.8 | |
| Total formal votes | 22,977 | 98.9 | +0.1 | ||
| Informal votes | 263 | 1.1 | -0.1 | ||
| Turnout | 23,240 | 92.8 | +0.2 | ||
| Two-party-preferred result | |||||
| Labor | Julie Attwood | 11,348 | 51.9 | +3.6 | |
| Liberal | Bob Harper | 10,497 | 48.1 | -3.6 | |
| Labor gain from Liberal | Swing | +3.6 | |||
Mulgrave
| Party | Candidate | Votes | % | ±% | |
|---|---|---|---|---|---|
| Labor | Warren Pitt | 8,464 | 37.0 | -8.2 | |
| One Nation | Charles Rappolt | 7,097 | 31.0 | +31.0 | |
| National | Naomi Wilson | 6,848 | 29.9 | -16.0 | |
| Democrats | Jo Gallo | 457 | 2.0 | -1.4 | |
| Total formal votes | 22,866 | 98.8 | +0.4 | ||
| Informal votes | 281 | 1.2 | -0.4 | ||
| Turnout | 23,147 | 92.9 | +2.2 | ||
| Two-candidate-preferred result | |||||
| One Nation | Charles Rappolt | 11,694 | 54.1 | +54.1 | |
| Labor | Warren Pitt | 9,903 | 45.9 | -3.7 | |
| One Nation gain from National | Swing | +54.1 | |||
Mundingburra
| Party | Candidate | Votes | % | ±% | |
|---|---|---|---|---|---|
| Labor | Lindy Nelson-Carr | 8,756 | 44.7 | +0.9 | |
| Liberal | Frank Tanti | 6,011 | 30.7 | -13.7 | |
| One Nation | Trevor Elson | 4,807 | 24.6 | +24.6 | |
| Total formal votes | 19,574 | 98.3 | -0.2 | ||
| Informal votes | 331 | 1.7 | +0.2 | ||
| Turnout | 19,905 | 92.4 | +3.8 | ||
| Two-party-preferred result | |||||
| Labor | Lindy Nelson-Carr | 9,884 | 53.8 | +3.8 | |
| Liberal | Frank Tanti | 8,486 | 46.2 | -3.8 | |
| Labor hold | Swing | +3.8 | |||
Murrumba
| Party | Candidate | Votes | % | ±% | |
|---|---|---|---|---|---|
| Labor | Dean Wells | 10,266 | 45.9 | -11.3 | |
| One Nation | Tony Cleaver | 6,429 | 28.8 | +28.8 | |
| Liberal | Susan Haskell | 4,741 | 21.2 | -21.6 | |
| Democrats | Peter Kennedy | 658 | 2.9 | +2.9 | |
| Reform | Mark Lewry | 266 | 1.2 | +1.2 | |
| Total formal votes | 22,360 | 98.5 | +0.9 | ||
| Informal votes | 339 | 1.5 | -0.9 | ||
| Turnout | 22,699 | 93.7 | +0.8 | ||
| Two-candidate-preferred result | |||||
| Labor | Dean Wells | 11,639 | 55.0 | -2.2 | |
| One Nation | Tony Cleaver | 9,509 | 45.0 | +45.0 | |
| Labor hold | Swing | -2.2 | |||
Nerang
The results for Nerang were:[11]
| Party | Candidate | Votes | % | ±% | |
|---|---|---|---|---|---|
| Liberal | Ray Connor | 10,336 | 38.6 | -19.2 | |
| Labor | Peter Burke | 7,406 | 27.7 | -3.6 | |
| One Nation | John Coyle | 6,719 | 25.1 | +25.1 | |
| Greens | Jacquie Hughes | 1,572 | 5.9 | -5.0 | |
| Democrats | Lynne Grimsey | 569 | 2.1 | +2.1 | |
| Reform | Richard Balcke | 138 | 0.5 | +0.5 | |
| Total formal votes | 26,740 | 98.4 | +0.1 | ||
| Informal votes | 432 | 1.6 | -0.1 | ||
| Turnout | 27,172 | 91.2 | +1.2 | ||
| Two-party-preferred result | |||||
| Liberal | Ray Connor | 14,177 | 61.0 | -2.6 | |
| Labor | Peter Burke | 9,064 | 39.0 | +2.6 | |
| Liberal hold | Swing | -2.6 | |||
Nicklin
| Party | Candidate | Votes | % | ±% | |
|---|---|---|---|---|---|
| National | Neil Turner | 6,878 | 26.9 | -30.9 | |
| Independent | Peter Wellington | 6,562 | 25.6 | +25.6 | |
| One Nation | Santo Ferraro | 6,039 | 23.6 | +23.6 | |
| Labor | Coleen Giles | 5,426 | 21.2 | -10.5 | |
| Democrats | Geoff Armstrong | 695 | 2.7 | -7.8 | |
| Total formal votes | 25,600 | 98.8 | +0.4 | ||
| Informal votes | 323 | 1.2 | -0.4 | ||
| Turnout | 25,923 | 92.2 | +1.5 | ||
| Two-candidate-preferred result | |||||
| Independent | Peter Wellington | 12,159 | 55.7 | +55.7 | |
| National | Neil Turner | 9,657 | 44.3 | -18.6 | |
| Independent gain from National | Swing | +55.7 | |||
Noosa
| Party | Candidate | Votes | % | ±% | |
|---|---|---|---|---|---|
| Liberal | Bruce Davidson | 11,932 | 45.3 | -12.8 | |
| Labor | Don Sfiligoj | 7,871 | 29.9 | -7.3 | |
| One Nation | David Summers | 3,767 | 14.3 | +14.3 | |
| Greens | Peter Sykes | 1,618 | 6.1 | +6.1 | |
| Christian Democrats | Eddie Taylor | 833 | 3.2 | +3.2 | |
| Independent | Robert Logan | 258 | 1.0 | +1.0 | |
| Independent | John Jones | 70 | 0.3 | +0.3 | |
| Total formal votes | 26,349 | 98.1 | -0.4 | ||
| Informal votes | 510 | 1.9 | +0.4 | ||
| Turnout | 26,859 | 90.7 | +0.4 | ||
| Two-party-preferred result | |||||
| Liberal | Bruce Davidson | 14,291 | 59.9 | -1.4 | |
| Labor | Don Sfiligoj | 9,585 | 40.1 | +1.4 | |
| Liberal hold | Swing | -1.4 | |||
Nudgee
| Party | Candidate | Votes | % | ±% | |
|---|---|---|---|---|---|
| Labor | Neil Roberts | 11,788 | 55.9 | -4.8 | |
| Liberal | Paul Varley | 4,750 | 22.5 | -16.7 | |
| One Nation | Wayne Whitney | 3,632 | 17.2 | +17.2 | |
| Greens | Mike Stasse | 734 | 3.5 | +3.5 | |
| Reform | Keith Lane | 172 | 0.8 | +0.8 | |
| Total formal votes | 21,076 | 98.6 | +1.1 | ||
| Informal votes | 294 | 1.4 | -1.1 | ||
| Turnout | 21,370 | 94.4 | +1.4 | ||
| Two-party-preferred result | |||||
| Labor | Neil Roberts | 13,289 | 67.4 | +6.7 | |
| Liberal | Paul Varley | 6,421 | 32.6 | -6.7 | |
| Labor hold | Swing | +6.7 | |||
Redcliffe
| Party | Candidate | Votes | % | ±% | |
|---|---|---|---|---|---|
| Labor | Ray Hollis | 8,136 | 42.5 | -2.1 | |
| Liberal | Allan Sutherland | 5,864 | 30.6 | -9.5 | |
| One Nation | Phil Knight | 4,370 | 22.8 | +22.8 | |
| Independent | Bill Turner | 453 | 2.4 | +2.4 | |
| Reform | Terry Fleming | 324 | 1.7 | +1.7 | |
| Total formal votes | 19,147 | 98.5 | +0.7 | ||
| Informal votes | 287 | 1.5 | -0.7 | ||
| Turnout | 19,434 | 92.9 | +1.4 | ||
| Two-party-preferred result | |||||
| Labor | Ray Hollis | 9,349 | 52.3 | +1.9 | |
| Liberal | Allan Sutherland | 8,522 | 47.7 | -1.9 | |
| Labor hold | Swing | +1.9 | |||
Redlands
| Party | Candidate | Votes | % | ±% | |
|---|---|---|---|---|---|
| Labor | John Budd | 10,226 | 38.5 | -2.2 | |
| National | John Hegarty | 8,703 | 32.8 | -13.0 | |
| One Nation | June Woodward | 6,234 | 23.5 | +23.5 | |
| Democrats | Graham Jenkin | 1,092 | 4.1 | -4.5 | |
| Reform | Don Ruwoldt | 302 | 1.1 | +1.1 | |
| Total formal votes | 26,557 | 98.5 | +0.2 | ||
| Informal votes | 416 | 1.5 | -0.2 | ||
| Turnout | 26,973 | 94.0 | +1.0 | ||
| Two-party-preferred result | |||||
| National | John Hegarty | 12,652 | 51.0 | -3.6 | |
| Labor | John Budd | 12,165 | 49.0 | +3.6 | |
| National hold | Swing | -3.6 | |||
Rockhampton
| Party | Candidate | Votes | % | ±% | |
|---|---|---|---|---|---|
| Labor | Robert Schwarten | 9,690 | 50.9 | -1.0 | |
| One Nation | Len Timms | 4,919 | 25.9 | +25.9 | |
| National | Karen Mackay | 3,677 | 19.3 | -18.6 | |
| Democrats | Fay Lawrence | 740 | 3.9 | -0.6 | |
| Total formal votes | 19,026 | 98.6 | +0.4 | ||
| Informal votes | 267 | 1.4 | -0.4 | ||
| Turnout | 19,293 | 94.1 | +2.0 | ||
| Two-candidate-preferred result | |||||
| Labor | Robert Schwarten | 10,853 | 59.6 | +3.2 | |
| One Nation | Len Timms | 7,355 | 40.4 | +40.4 | |
| Labor hold | Swing | +3.2 | |||
Sandgate
| Party | Candidate | Votes | % | ±% | |
|---|---|---|---|---|---|
| Labor | Gordon Nuttall | 11,155 | 49.4 | -6.6 | |
| Liberal | Don Young | 4,546 | 20.1 | -19.7 | |
| One Nation | Elizabeth Thurman | 4,176 | 18.5 | +18.5 | |
| Independent | Anne Hobbs | 1,812 | 8.0 | +8.0 | |
| Greens | Peter Burgoyne | 631 | 2.8 | +2.8 | |
| Reform | Fay Mills | 243 | 1.1 | +1.1 | |
| Total formal votes | 22,563 | 98.5 | +0.5 | ||
| Informal votes | 340 | 1.5 | -0.5 | ||
| Turnout | 22,903 | 93.4 | +0.8 | ||
| Two-party-preferred result | |||||
| Labor | Gordon Nuttall | 13,272 | 66.0 | +8.1 | |
| Liberal | Don Young | 6,841 | 34.0 | -8.1 | |
| Labor hold | Swing | +8.1 | |||
South Brisbane
| Party | Candidate | Votes | % | ±% | |
|---|---|---|---|---|---|
| Labor | Anna Bligh | 10,591 | 53.4 | +2.2 | |
| Liberal | Leo Tsimpikas | 5,209 | 26.3 | -7.7 | |
| One Nation | Raymond Meiers | 1,592 | 8.0 | +8.0 | |
| Democrats | Anthony Lee | 1,013 | 5.1 | -3.7 | |
| Independent | Guy Freemarijuana | 527 | 2.7 | +2.7 | |
| Independent | Murray Swan | 375 | 1.9 | +1.9 | |
| Independent | Coral Wynter | 278 | 1.4 | +1.4 | |
| Australia First | Mario Zocchi | 185 | 0.9 | +0.9 | |
| Reform | Chris Ray | 66 | 0.3 | +0.3 | |
| Total formal votes | 19,836 | 98.3 | +1.3 | ||
| Informal votes | 351 | 1.7 | -1.3 | ||
| Turnout | 20,187 | 90.0 | +3.5 | ||
| Two-party-preferred result | |||||
| Labor | Anna Bligh | 12,390 | 66.3 | +5.6 | |
| Liberal | Leo Tsimpikas | 6,300 | 33.7 | -5.6 | |
| Labor hold | Swing | +5.6 | |||
Southport
| Party | Candidate | Votes | % | ±% | |
|---|---|---|---|---|---|
| National | Mick Veivers | 9,000 | 39.0 | -12.3 | |
| Labor | Peter Lawlor | 8,429 | 36.5 | -3.9 | |
| One Nation | Jay Nauss | 4,907 | 21.3 | +21.3 | |
| Democrats | John Huta | 735 | 3.2 | -2.1 | |
| Total formal votes | 23,071 | 98.3 | +0.3 | ||
| Informal votes | 399 | 1.7 | -0.3 | ||
| Turnout | 23,470 | 91.0 | +1.0 | ||
| Two-party-preferred result | |||||
| National | Mick Veivers | 11,127 | 53.8 | -1.1 | |
| Labor | Peter Lawlor | 9,573 | 46.2 | +1.1 | |
| National hold | Swing | -1.1 | |||
Springwood
| Party | Candidate | Votes | % | ±% | |
|---|---|---|---|---|---|
| Labor | Grant Musgrove | 7,047 | 38.2 | +6.5 | |
| Liberal | Luke Woolmer | 6,270 | 34.0 | -3.9 | |
| One Nation | Neil Pitt | 3,691 | 20.0 | +20.0 | |
| Democrats | Paul Thomson | 878 | 4.8 | -13.8 | |
| Independent | Allan De Brenni | 477 | 2.6 | -1.0 | |
| Reform | Mark Mackintosh | 62 | 0.3 | +0.3 | |
| Total formal votes | 18,425 | 98.6 | +0.1 | ||
| Informal votes | 269 | 1.4 | -0.1 | ||
| Turnout | 18,694 | 93.6 | +1.3 | ||
| Two-party-preferred result | |||||
| Labor | Grant Musgrove | 8,518 | 50.6 | +11.3 | |
| Liberal | Luke Woolmer | 8,327 | 49.4 | -11.3 | |
| Labor gain from Liberal | Swing | +11.3 | |||
Sunnybank
| Party | Candidate | Votes | % | ±% | |
|---|---|---|---|---|---|
| Labor | Stephen Robertson | 12,691 | 47.5 | +0.1 | |
| Liberal | Steven Huang | 8,229 | 30.8 | -15.1 | |
| One Nation | Ken Lock | 4,646 | 17.4 | +17.4 | |
| Greens | Andrew Grigg | 1,172 | 4.4 | +4.4 | |
| Total formal votes | 26,738 | 98.5 | +0.1 | ||
| Informal votes | 406 | 1.5 | -0.1 | ||
| Turnout | 27,144 | 93.0 | +0.1 | ||
| Two-party-preferred result | |||||
| Labor | Stephen Robertson | 14,708 | 58.2 | +6.8 | |
| Liberal | Steven Huang | 10,572 | 41.8 | -6.8 | |
| Labor hold | Swing | +6.8 | |||
Surfers Paradise
| Party | Candidate | Votes | % | ±% | |
|---|---|---|---|---|---|
| National | Rob Borbidge | 10,880 | 56.4 | -10.9 | |
| Labor | Steve Axe | 4,167 | 21.6 | -3.5 | |
| One Nation | Phil Connolly | 3,354 | 17.4 | +17.4 | |
| Greens | Ray Schearer | 894 | 4.6 | +4.6 | |
| Total formal votes | 19,295 | 98.3 | -0.1 | ||
| Informal votes | 325 | 1.7 | +0.1 | ||
| Turnout | 19,620 | 88.4 | +2.0 | ||
| Two-party-preferred result | |||||
| National | Rob Borbidge | 12,907 | 72.3 | +0.5 | |
| Labor | Steve Axe | 4,955 | 27.7 | -0.5 | |
| National hold | Swing | +0.5 | |||
Tablelands
| Party | Candidate | Votes | % | ±% | |
|---|---|---|---|---|---|
| One Nation | Shaun Nelson | 8,335 | 42.0 | +42.0 | |
| National | Tom Gilmore | 6,521 | 32.9 | -36.5 | |
| Labor | Nigel Tucker | 4,973 | 25.1 | +0.6 | |
| Total formal votes | 19,829 | 98.8 | +0.5 | ||
| Informal votes | 230 | 1.2 | -0.5 | ||
| Turnout | 20,059 | 92.6 | +2.9 | ||
| Two-candidate-preferred result | |||||
| One Nation | Shaun Nelson | 9,106 | 50.3 | +50.3 | |
| National | Tom Gilmore | 9,006 | 49.7 | -23.3 | |
| One Nation gain from National | Swing | +50.3 | |||
Thuringowa
| Party | Candidate | Votes | % | ±% | |
|---|---|---|---|---|---|
| Labor | Ken McElligott | 8,976 | 35.1 | -11.3 | |
| One Nation | Ken Turner | 8,918 | 34.9 | +34.9 | |
| Liberal | David Moore | 4,430 | 17.3 | +17.3 | |
| National | Ross Contarino | 2,434 | 9.5 | -34.6 | |
| Democrats | Annette Reed | 518 | 2.0 | -7.4 | |
| Independent | Lilian Malcolm | 278 | 1.1 | +1.1 | |
| Total formal votes | 25,554 | 98.4 | +0.3 | ||
| Informal votes | 405 | 1.6 | -0.3 | ||
| Turnout | 25,959 | 93.4 | +2.8 | ||
| Two-candidate-preferred result | |||||
| One Nation | Ken Turner | 13,720 | 56.6 | +56.6 | |
| Labor | Ken McElligott | 10,508 | 43.4 | -8.0 | |
| One Nation gain from Labor | Swing | +56.6 | |||
Toowoomba North
| Party | Candidate | Votes | % | ±% | |
|---|---|---|---|---|---|
| National | Graham Healy | 7,678 | 39.8 | -16.9 | |
| Labor | Kerry Shine | 6,634 | 34.4 | -4.0 | |
| One Nation | Ron Davy | 4,654 | 24.1 | +24.1 | |
| Reform | Barry Reid | 319 | 1.7 | +1.7 | |
| Total formal votes | 19,285 | 98.9 | +0.6 | ||
| Informal votes | 214 | 1.1 | -0.6 | ||
| Turnout | 19,499 | 93.7 | +1.0 | ||
| Two-party-preferred result | |||||
| National | Graham Healy | 10,475 | 58.2 | -1.4 | |
| Labor | Kerry Shine | 7,522 | 41.8 | +1.4 | |
| National hold | Swing | -1.4 | |||
Toowoomba South
| Party | Candidate | Votes | % | ±% | |
|---|---|---|---|---|---|
| National | Mike Horan | 9,328 | 46.5 | -19.8 | |
| Labor | Andrew Isfree | 5,615 | 28.0 | -5.7 | |
| One Nation | Darryl Shoesmith | 4,748 | 23.7 | +23.7 | |
| Reform | Andrew Chambers | 357 | 1.8 | +1.8 | |
| Total formal votes | 20,048 | 98.9 | +0.4 | ||
| Informal votes | 226 | 1.1 | -0.4 | ||
| Turnout | 20,274 | 93.5 | +1.6 | ||
| Two-party-preferred result | |||||
| National | Mike Horan | 11,627 | 63.4 | -2.9 | |
| Labor | Andrew Isfree | 6,725 | 36.6 | +2.9 | |
| National hold | Swing | -2.9 | |||
Townsville
| Party | Candidate | Votes | % | ±% | |
|---|---|---|---|---|---|
| Labor | Mike Reynolds | 8,948 | 44.6 | +0.7 | |
| Liberal | Joy Rutledge | 5,411 | 27.0 | -15.2 | |
| One Nation | Ted Ive | 4,948 | 24.7 | +24.7 | |
| Independent | Billy Tait | 430 | 2.1 | +2.1 | |
| Reform | Steve McGuire | 308 | 1.5 | +1.5 | |
| Total formal votes | 20,045 | 97.7 | -0.4 | ||
| Informal votes | 471 | 2.3 | +0.4 | ||
| Turnout | 20,516 | 90.2 | +3.8 | ||
| Two-party-preferred result | |||||
| Labor | Mike Reynolds | 10,360 | 57.7 | +6.0 | |
| Liberal | Joy Rutledge | 7,581 | 42.3 | -6.0 | |
| Labor hold | Swing | +6.0 | |||
Warrego
| Party | Candidate | Votes | % | ±% | |
|---|---|---|---|---|---|
| National | Howard Hobbs | 5,550 | 42.0 | -28.7 | |
| Labor | Elizabeth Pommer | 3,287 | 24.9 | -4.4 | |
| One Nation | Victor Espie | 3,118 | 23.6 | +23.6 | |
| Independent | Sandy Kidd | 1,075 | 8.1 | +8.1 | |
| Shooters | Bev Salisbury | 186 | 1.4 | +1.4 | |
| Total formal votes | 13,216 | 98.7 | +0.1 | ||
| Informal votes | 170 | 1.3 | -0.1 | ||
| Turnout | 13,386 | 93.1 | +1.6 | ||
| Two-party-preferred result | |||||
| National | Howard Hobbs | 7,810 | 65.3 | -5.4 | |
| Labor | Elizabeth Pommer | 4,146 | 34.7 | +5.4 | |
| National hold | Swing | -5.4 | |||
Warwick
The results for Warwick were:[12]
| Party | Candidate | Votes | % | ±% | |
|---|---|---|---|---|---|
| National | Lawrence Springborg | 9,443 | 45.9 | -21.0 | |
| One Nation | Joan White | 6,242 | 30.3 | +30.3 | |
| Labor | Jeffrey Singleton | 4,091 | 19.9 | -8.0 | |
| Greens | Kim Olsen | 814 | 4.0 | -1.3 | |
| Total formal votes | 20,590 | 98.7 | -0.1 | ||
| Informal votes | 280 | 1.3 | +0.1 | ||
| Turnout | 20,870 | 94.3 | +0.7 | ||
| Two-candidate-preferred result | |||||
| National | Lawrence Springborg | 11,628 | 61.8 | -7.7 | |
| One Nation | Joan White | 7,172 | 38.2 | +38.2 | |
| National hold | Swing | -7.7 | |||
Waterford
| Party | Candidate | Votes | % | ±% | |
|---|---|---|---|---|---|
| Labor | Tom Barton | 10,494 | 46.2 | -12.9 | |
| One Nation | Jim Hebbard | 6,643 | 29.3 | +29.3 | |
| Liberal | Aidan McLindon | 5,571 | 24.5 | -16.4 | |
| Total formal votes | 22,708 | 98.3 | +1.4 | ||
| Informal votes | 394 | 1.7 | -1.4 | ||
| Turnout | 23,102 | 90.7 | +2.6 | ||
| Two-candidate-preferred result | |||||
| Labor | Tom Barton | 11,892 | 55.2 | -3.9 | |
| One Nation | Jim Hebbard | 9,647 | 44.8 | +44.8 | |
| Labor hold | Swing | -3.9 | |||
Western Downs
The results for Western Downs were:[13]
| Party | Candidate | Votes | % | ±% | |
|---|---|---|---|---|---|
| National | Brian Littleproud | 9,864 | 48.2 | -31.2 | |
| One Nation | Peter McLaren | 7,068 | 34.5 | +34.5 | |
| Labor | Ron Lockwood | 3,544 | 17.3 | -3.3 | |
| Total formal votes | 20,476 | 99.0 | +0.2 | ||
| Informal votes | 217 | 1.0 | -0.2 | ||
| Turnout | 20,693 | 94.3 | +0.5 | ||
| Two-candidate-preferred result | |||||
| National | Brian Littleproud | 11,428 | 59.4 | -20.0 | |
| One Nation | Peter McLaren | 7,805 | 40.6 | +40.6 | |
| National hold | Swing | -20.0 | |||
Whitsunday
| Party | Candidate | Votes | % | ±% | |
|---|---|---|---|---|---|
| Labor | Lorraine Bird | 8,670 | 39.7 | -4.9 | |
| One Nation | Harry Black | 6,703 | 30.7 | +30.7 | |
| National | Ian Roebuck | 6,452 | 29.6 | -15.7 | |
| Total formal votes | 21,825 | 98.8 | +0.3 | ||
| Informal votes | 256 | 1.2 | -0.3 | ||
| Turnout | 22,081 | 93.1 | +1.8 | ||
| Two-candidate-preferred result | |||||
| One Nation | Harry Black | 10,607 | 51.7 | +51.7 | |
| Labor | Lorraine Bird | 9,896 | 48.3 | -1.9 | |
| One Nation gain from Labor | Swing | +51.7 | |||
Woodridge
| Party | Candidate | Votes | % | ±% | |
|---|---|---|---|---|---|
| Labor | Bill D'Arcy | 8,009 | 51.7 | -9.9 | |
| One Nation | Leonce Kealy | 4,401 | 28.4 | +28.4 | |
| Liberal | Adam Young | 2,169 | 14.0 | -11.5 | |
| Democrats | Robert Hernandez | 923 | 6.0 | +6.0 | |
| Total formal votes | 15,502 | 97.4 | +0.5 | ||
| Informal votes | 410 | 2.6 | -0.5 | ||
| Turnout | 15,912 | 90.5 | +3.2 | ||
| Two-candidate-preferred result | |||||
| Labor | Bill D'Arcy | 8,791 | 63.5 | -4.6 | |
| One Nation | Leonce Kealy | 5,048 | 36.5 | +36.5 | |
| Labor hold | Swing | -4.6 | |||
Yeronga
The results for Yeronga were:[14]
| Party | Candidate | Votes | % | ±% | |
|---|---|---|---|---|---|
| Labor | Matt Foley | 9,979 | 52.6 | +1.7 | |
| Liberal | John Webster | 5,323 | 28.1 | -13.3 | |
| One Nation | Vanessa Pacitto | 2,532 | 13.4 | +13.4 | |
| Greens | Stephen Burchall | 1,006 | 5.3 | +5.3 | |
| Reform | Rick Stapleton | 119 | 0.6 | +0.6 | |
| Total formal votes | 18,959 | 98.6 | +0.4 | ||
| Informal votes | 274 | 1.4 | -0.4 | ||
| Turnout | 19,233 | 92.8 | +1.5 | ||
| Two-party-preferred result | |||||
| Labor | Matt Foley | 11,218 | 62.5 | +7.9 | |
| Liberal | John Webster | 6,739 | 37.5 | -7.9 | |
| Labor hold | Swing | +7.9 | |||
See also
References
- ↑ Wanna, John (December 1998). "Australian Political Chronicle: January–June 1998". Australian Journal of Politics and History. 44 (4): 593. ISSN 0004-9522.
- ↑ Hughes, Colin A. (2002). A handbook of Australian government and politics, 1985-1999. Federation Press. p. 329. ISBN 978-1-86287-434-3.
- ↑ "Archerfield - 1998 - Election Archive - ABC News (Australian Broadcasting Corporation)". Archived from the original on 20 September 2012. Retrieved 26 January 2018.
- ↑ "Barambah - 1998 - Election Archive - ABC News (Australian Broadcasting Corporation)". Archived from the original on 20 September 2012. Retrieved 26 January 2018.
- ↑ "Caboolture - 1998 - Election Archive - ABC News (Australian Broadcasting Corporation)". Archived from the original on 30 May 2016. Retrieved 26 January 2018.
- ↑ "Chermside - 1998 - Election Archive - ABC News (Australian Broadcasting Corporation)". Archived from the original on 20 September 2012. Retrieved 26 January 2018.
- ↑ "Crows Nest - 1998 - Election Archive - ABC News (Australian Broadcasting Corporation)". Archived from the original on 20 September 2012. Retrieved 26 January 2018.
- ↑ "Kedron - 1998 - Election Archive - ABC News (Australian Broadcasting Corporation)". Archived from the original on 30 May 2016. Retrieved 26 January 2018.
- ↑ "Merrimac - 1998 - Election Archive - ABC News (Australian Broadcasting Corporation)". www.abc.net.au. Archived from the original on 30 May 2016. Retrieved 13 April 2020.
- ↑ "Mooloolah - 1998 - Election Archive - ABC News (Australian Broadcasting Corporation)". www.abc.net.au. Archived from the original on 30 May 2016. Retrieved 13 April 2020.
- ↑ "Nerang - 1998 - Election Archive - ABC News (Australian Broadcasting Corporation)". www.abc.net.au. Archived from the original on 30 May 2016. Retrieved 13 April 2020.
- ↑ "Warwick - 1998 - Election Archive - ABC News (Australian Broadcasting Corporation)". www.abc.net.au. Archived from the original on 30 May 2016. Retrieved 13 April 2020.
- ↑ "Western Downs - 1998 - Election Archive - ABC News (Australian Broadcasting Corporation)". www.abc.net.au. Archived from the original on 30 May 2016. Retrieved 13 April 2020.
- ↑ "Yeronga - 1998 - Election Archive - ABC News (Australian Broadcasting Corporation)". www.abc.net.au. Archived from the original on 30 May 2016. Retrieved 13 April 2020.
This article is issued from Wikipedia. The text is licensed under Creative Commons - Attribution - Sharealike. Additional terms may apply for the media files.