The Surface Heat Budget of the Arctic Ocean (SHEBA) study was a National Science Foundation-funded research project designed to quantify the heat transfer processes that occur between the ocean and the atmosphere over the course of a year in the Arctic Ocean, where the sun is above the horizon from spring through summer and below the horizon the rest of the time. The study was designed to provide data for use in global climate models, which scientists use to study global climate change.[1]
Background
Ice reflects sunlight more readily than open water. Snow-covered sea ice reflects about 80% of the incident sunlight. Seasonal changes in the Arctic result in clear skies and radiational cooling from snow-covered sea ice in the constantly dark arctic winter. In spring, with the return of sunlight, melt pools begin to form and increase the rate of heat absorption from the sun. In the summer, during constant daylight, clouds form which reflect light to the sky, but impede heat flow from the ocean. In order to quantify these effects over a large portion of earth's area—the Arctic Ocean—required a large-scale scientific data-gathering and analysis effort over the span of a year.[1] Consequently, the National Science Foundation, together with other sponsors,[2] funded a study to better quantify these processes.[3]
Ice Station SHEBA

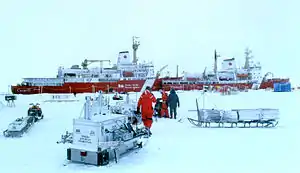
The scientific party traveled aboard the Canadian Coast Guard Ship Des Groseilliers to the Arctic Ocean. It arrived at a location on 2 October 1997 where the plan was to allow the ship to become frozen in the pack ice and be the base for scientific observations. Those observations included measurements of the oceanic and atmospheric processes from the water beneath the ice, near the ship, to the top of the atmosphere. Measurements included:
- Radiative fluxes: longwave and shortwave
- Heat flux: turbulent fluxes of latent and sensible heat
- Cloud height, thickness and other properties
- Processes of energy exchange in the boundary layers of the atmosphere and ocean
- Snow depth and ice thickness
- Ocean salinity, temperature, and currents
The ship remained stationary with respect to the ice for one year, leaving on 11 October 1998. It became known as "Ice Station SHEBA."[1][4]
Results

The scientists found clouds to be common at the ship's location throughout the year. In the midwinter, there was reportedly overcast 40% of the time and in the summer the sky was continually overcast. The air temperature was 0.6 °C lower than the regional climatological average temperature. With no sun in the winter, the net flow of heat (flux) was from the surface of the ocean to the sky, marked by large differences in flux with changes in cloud cover. In April the flux changed toward solar warming of the surface of the sea, which reached a maximum in July when sunlight was strongest and the ice developed melt ponds that were much darker than snow and could absorb sunlight more efficiently.[1]
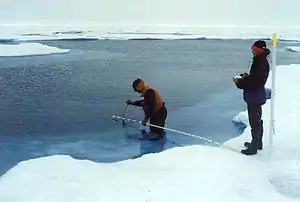
The scientists also measured the net change in mass of the ice and snowpack at 100 sites. They noted a wide variability of change over the region surrounding the ship. They determined that, with the waning sunlight of fall, the temperature in the ice dropped such that, by November, it was generating new growth at the bottom of the ice pack. From these observations, they identified five phases of change in heat budget:[1]
- Dry snow
- Melting snow
- Pond formation
- Pond evolution
- Fall freeze-up
The accurate measurements of ice mass balance from ablation stakes during SHEBA showed that the greatest surface melt was observed at ponded ice, while the greatest bottom melt was observed at pressure ridges. The bottom melt of pressure ridges was 60% higher than that of undeformed first-year ice. The energy flux from solar radiation to the ocean via leads was not enough to balance the observed bottom ablation.[5] During summer period 15% of the under-ice area was covered by under-ice meltwater layers and false bottoms. The average depth of under-ice meltwater layers was 0.31 m with a salinity of 1.5. The average thickness of false bottoms was 0.2 m.[6]
Modeling
The experimental results allowed meaningful modeling of the seasonal heat budget processes occurring through the Arctic Ocean sea ice and atmosphere. The scope of the model was the column from below the ice pack through the top of the atmosphere. The scientists realized that key to the model was correctly characterizing the changing reflectivity or albedo of the ice surface, owing to changes in snow pack and ice melting. Cloud cover was key to describing how much energy reached or escaped the ocean surface.[1]
Ocean processes
The model incorporated the observation that solar radiation is the dominant heat source to the surface. It accounted for the change in open ocean from a 5% maximum in June and the changes in albedo. Approximately 8% of incoming solar radiation was absorbed into the ocean through the ice.[1]
Atmosphere processes
The scientists were able to define parameters for near-surface turbulence that characterize the degree to which air movement can cool or warm the surface of the ice, seasonally. In summer, the surface becomes rougher and slows down air flow. The lidar cloud measurements and balloonsonde temperature and turbulence data allowed scientific characterization of the role of the atmosphere above the ice in promoting or inhibiting the warming or cooling of the ocean surface.[1]
Participants
The following individuals and organizations participated in SHEBA:[3]
References
- 1 2 3 4 5 6 7 8 Perovich, Donald; Moritz, Richard C.; Weatherly, John (2003), SHEBA: The Surface Heat Budget of the Arctic Ocean (PDF) (03048 ed.), National Science Foundation
- ↑ Primary sponsorship came from the NSF Arctic System Science Program, under grants from the Office of Polar Programs (Division of Ocean Sciences and Division of Atmospheric Sciences), with additional support from the Office of Naval Research and the Japan Marine Science and Technology Center.
- 1 2 Uttal, Taneil; Curry, Judith A.; McPhee, Miles G.; Perovich, Donald K.; et al. (February 2002), "Surface Heat Budget of the Arctic Ocean" (PDF), Bulletin of the American Meteorological Society, 83 (2): 255–275, doi:10.1175/1520-0477(2002)083<0255:SHBOTA>2.3.CO;2, 2011-01-12, archived from the original (PDF) on 2011-07-26
- ↑ "Ice Station SHEBA" is a reference to the novel, Ice Station Zebra, or film.
- ↑ Perovich, D.K.; Grenfell, T.C.; Richter-Menge, J.A.; Light, B.; Tucker, W.B.; Eicken, Hajo (2003). "Thin and thinner: Sea ice mass balance measurements during SHEBA". Journal of Geophysical Research: Oceans. 108 (3). doi:10.1029/2001JC001079.
- ↑ Eicken, H. (1994). "Structure of under-ice melt ponds in the central Arctic and their effect on, the sea-ice cover". Limnology and Oceanography. 29 (3). doi:10.4319/lo.1994.39.3.0682.