Single-molecule fluorescence (or Förster) resonance energy transfer (or smFRET) is a biophysical technique used to measure distances at the 1-10 nanometer scale in single molecules, typically biomolecules. It is an application of FRET wherein a pair of donor and acceptor fluorophores are excited and detected at a single molecule level. In contrast to "ensemble FRET" which provides the FRET signal of a high number of molecules, single-molecule FRET is able to resolve the FRET signal of each individual molecule. The variation of the smFRET signal is useful to reveal kinetic information that an ensemble measurement cannot provide, especially when the system is under equilibrium with no ensemble/bulk signal change. Heterogeneity among different molecules can also be observed. This method has been applied in many measurements of intramolecular dynamics such as DNA/RNA/protein folding/unfolding and other conformational changes, and intermolecular dynamics such as reaction, binding, adsorption, and desorption that are particularly useful in chemical sensing, bioassays, and biosensing.
Methodology
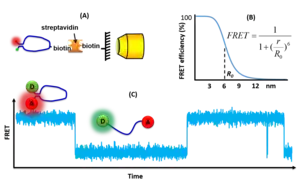
Single-molecule FRET measurements are typically performed on fluorescence microscopes, either using surface-immobilized or freely-diffusing molecules. Single FRET pairs are illuminated using intense light sources, typically lasers, in order to generate sufficient fluorescence signals to enable single-molecule detection. Wide-field multiphoton microscopy is typically combined with total internal reflection fluorescence microscope (TIRF). This selectively excites FRET pairs on the surface of the measurement chamber and rejects noise from the bulk of the sample. Alternatively, confocal microscopy minimizes background by focusing the fluorescence light onto a pinhole to reject out-of-focus light.[1] The confocal volume has a diameter of around 220 nm, and therefore it must be scanned across if an image of the sample is needed. With confocal excitation, it is possible to measure much deeper into the sample than when using TIRF. The fluorescence signal is detected either using ultra-sensitive CCD or scientific CMOS cameras for wide-field microscopy or SPADs for confocal microscopy.[2] Once the single molecule intensities vs. time are available the FRET efficiency can be computed for each FRET pair as a function of time and thereby it is possible to follow kinetic events on the single molecule scale and to build FRET histograms showing the distribution of states in each molecule. However, data from many FRET pairs must be recorded and combined in order to obtain general information about a sample [3] or a dynamic structure.[4]
Surface-immobilized
In surface-immobilized experiments, biomolecules labeled with fluorescent tags are bound to the surface of the coverglass and images of fluorescence are acquired (typically by a CCD or scientific CMOS cameras).[5] Data collection with cameras will produce movies of the specimen which must be processed to derive the single-molecule intensities with time. If a confocal microscope with a SPAD detector is used, molecule searching is done first by scanning the sample. Then the confocal point sits on a molecule and collects intensity-time data directly, giving the sample drifting is negligible, or an active feedback loop is used to keep track of the molecule.
An advantage of surface-immobilized experiments is that many molecules can be observed in parallel for an extended period of time until photobleaching (typically 1-30 s). This allows us to conveniently study transitions taking place on slow time scales. A disadvantage is represented by the additional biochemical modifications needed to link molecules to the surface and the perturbations that the surface can potentially exert on the molecular activity. In addition, the maximum time resolution of single-molecule intensities is limited by the camera acquisition time (typically >1 ms).
Freely-diffusing
SmFRET can also be used to study the conformations of molecules freely diffusing in a liquid sample. In freely-diffusing smFRET experiments (or diffusion-based smFRET), the same biomolecules are free to diffuse in solution while being excited by a small excitation volume (usually a diffraction-limited spot). Bursts of photons due to a single-molecule crossing the excitation spot are acquired with SPAD detectors. The confocal spot is usually fixed in a given position (no scanning happens, and no image is acquired). Instead, the fluorescence photons emitted by individual molecules crossing the excitation volume are recorded and accumulated in order to build a distribution of different populations present in the sample. Depending on the complexity of this distribution, acquisition times vary from ~5 min to several hours.
A distinctive advantage of setups employing SPAD detectors is that they are not limited by a "frame rate" or a fixed integration time like when using cameras. In fact, unlike cameras, SPADs produce a pulse every time a photon is detected, while additional electronics are needed to "timestamp" each pulse with 10-50 ns resolution. The high time resolution of confocal single-molecule FRET measurements allows observers to potentially detect dynamics on time scales as low as 10 μs. However, detecting "slow" transitions on timescales longer than the diffusion time (typically ~1 ms) is more difficult than in surface-immobilized experiments and generally requires much longer acquisitions.
Normally, the fluorescent emission of both donor and acceptor fluorophores is detected by two independent detectors and the FRET signal is computed from the ratio of intensities in the two channels. Some setup configurations further split each spectral channel (donor or acceptor) in two orthogonal polarizations (therefore requiring 4 detectors) and are able to measure both FRET and fluorescence anisotropy at the same time. In other configurations, 3 or 4 spectral channels are acquired at the same time in order to measure multiple FRET pairs at the same time. Both CW or pulsed lasers can be used as excitation sources. When using pulsed lasers, suitable acquisition hardware can measure the photon arrival time with respect to the last laser pulse with picosecond resolution, in the so-called time-correlated single photon counting (TCSPC) acquisition. In this configuration, each photon is characterized by a macro-time (i.e. a coarse 10-50 ns timestamp) and a micro-time (i.e. delay with respect to the last laser pulse). The latter can be used to extract lifetime information and obtain the FRET signal.
Data analysis
Typical smFRET data of a two-dye system are time trajectories of the fluorescent emission intensities of the donor dye and the acceptor dye, called the two channels. Mainly two methods are used to obtain the emission of the two dyes: (1) accumulative measurement uses a fixed exposure time of the cameras for each frame, such as PMT, APD, EMCCD, and CMOS camera; (2) single-photon arriving time sequence measured using PMT or APD detectors. The principle is to use optical filters or dichroic mirrors to separate the emissions of the two dyes and measure them in two channels. For example, a setup using two halves of a charge-coupled device (CCD) camera is explained in the literature.[6]
For a two-dye system, the emission signals are then used to calculate the FRET efficiency between the dyes over time. The FRET efficiency is the number of photons emitted from the acceptor dye over the sum of the emissions of the donor and the acceptor dye. The time trajectories produced in every experiment may contain signals from incomplete or incorrect labeling or even aggregates. To account for this multiple research groups have developed sophisticated tools for the time trace selection based on multiple metrics,[7][8] or using deep neural network.[9] Usually, only the donor dye is excited, but even more accurate information can be obtained if donor and acceptor dye are alternatingly excited.[10] In a single excitation scheme, the emission of the donor and acceptor dyes is just the number of photons collected for the two dyes divided by the photon collection efficiencies of the two channels respectively which are the functions of the collection efficiency, the filter and optical efficiency, and the camera efficiency of the two wavelength bands. These efficiencies can be calibrated for a given instrumental setup.
where FRET is the FRET efficiency of the two-dye system at a period of time, and are measured photon counts of the acceptor and donor channel respectively at the same period of time, and are the photon collection efficiencies of the two channels, and and are quantum yield of the two dyes. Thus, calculates the actual number of photons emitted from the dye. If the photon collection efficiencies of the two channels are similar and the actual FRET distance is not interested, one can set the two = 1, and the two quantum yields to 1 as well.
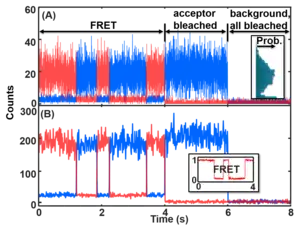
For the accumulative emission smFRET data, the time trajectories contain mainly the following information: (1) state transitions, (2) noise, (3) camera blurring (analog of motion blur), (4) photoblinking and photobleaching of the dyes. The state transition information is the information a typical measurement wants. However, the rest signals interfere with the data analysis and thus have to be addressed.
A list of software packages can be found on the KinSoftChallenge website.[11] A report on the comparison results among these software packages can be found here.[12][13]
Noise
The noise signal of the dye emission typically contains camera readout noise, shot noise and white noise, and real-sample noise, each following a different noise distribution due to the different sources. The real-sample noise comes from the thermal disturbance of the system that results in the FRET distance broadening, uneven dye orientation distribution, dye emission variations, fast blinking, and faster-than-integration-time kinetics. Slow variations of the dye emission are likely considered false-positive states that should be experimentally avoided by choosing different dyes. The other noises are from the excitation path and the detection path, especially the camera. In the end, the noise of the raw emission data is a combination of noises with Poisson distribution and Gaussian distribution. The noises in each channel sometimes (e.g. for single-photon detectors) can be simplified to the summation of an intensity-dependent Gaussian noise (the higher the count the larger the noise; it is a combination of Gaussian and larger-amplitude Poisson noise that can be represented by the Gaussian function) and a Poisson background noise (signal-count-independent). The latter noise dominates when the channel is in the OFF or low-intensity state (right figure). The noises can be approximated as Gaussian distribution, especially at relatively high signal counts. The noises in the two channels then are combined into the non-linear equation listed above to calculate the FRET values. Thus, the noise on the smFRET trajectories is very complicated. The noise is asymmetric above and below the mean FRET values and its magnitude changes towards the two ends (0 and 1) of the FRET values due to the changing uncertainties of the A and D channels. Most noise can be reduced by binning the data (see Figure) with the cost of losing time resolution. See GitHub (postFRET) for an example of MATLAB codes to simulate smFRET time trajectories without and with noise (GitHub link [14]).
Camera blurring
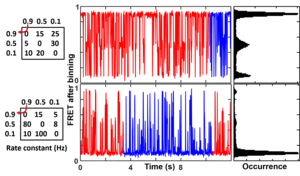
The camera blurring signal comes from the discrete nature of the measurements. The emission signal has a mismatch with the real transition signal because one or both are stochastic (random). When a state transition happens between the readout of two emission reading intervals, the signal is the average of the two parts in the same measuring window, which then affects the state identification accuracy and eventually the rate constant analysis. This is less of a problem when the measuring frequency is much faster than the transition rate but becomes a real problem when they approach each other (figure on the right). In order to reflect the camera blurring effect in the simulated smFRET trajectories, one must simulate the data in a higher time resolution (e.g. 10 times faster) than the data collection time and then bin the data into the final trajectories. See GitHub (postFRET)[14] for an example MATLAB codes to simulate smFRET time trajectories with a faster time resolution then bin it to the measuring time resolution (integration time) to simulate the camera blurring effect.
Photoblinking and photobleaching
The time trajectories also contain the photoblinking and photobleaching information of the two dyes. This information has to be removed which creates gaps in the time trajectory where the FRET information is lost. The photoblinking and photobleaching information can be removed for a typical dye system with relatively long photoblinking intervals and photobleaching lifetimes that have been chosen in the measurement. Thus, they are less of a problem for data analysis. However, it will become a big problem if a dye with short blinking intervals or a long dark-state lifetime is used. Specific chemical solutions have been developed to mitigate these two problems such as oxygen scavenger solutions or triplet state quenchers.
State identification algorithms
Several data analysis methods have been developed to analyze the data, such as thresholding methods, Hidden Markov Model (HMM) methods, and transition point identification methods. Thresholding methods simply set a threshold between two adjacent states on the smFRET trajectories. The FRET values above the threshold belong to one state and the values below belong to another. This method works for the data with a very high signal-to-noise ratio thus having distinguishable FRET states. This method is intuitive and has a long history of applications. An example source code can be found in the software postFRET.[14] HMMs are base on algorithms that statistically calculate probability functions of each state assignment, i.e. add penalties to a less probable assignment. The typical open source-code software packages can be found online such as HaMMy, vbFRET, ebFRET, SMART, SMACKS, MASH-FRET, etc.[15][16][17] Transition-point analysis or change-point analysis (CPA) uses algorithms to identify when a transition happens over the time trajectory using statistical analysis. For example, CPA based on Fisher information theory and the Student's t-test method (STaSI, open-source, GitHub link [18][19]) identifies state transitions and minimizes description length by selecting the optimum number of states, i.e. balancing the penalty of noise and the total number of states.
Rate analysis
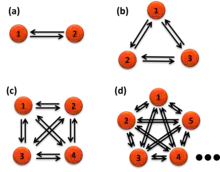
Once the states are identified, they can be used to calculate the Förster resonance energy transfer distances and transition rate constants between the states. For a parallel reaction matrix among the states, the rate constants of each transition cannot be pulled out from the average lifetimes of each transition, which is fixed as the inverse sum of the rate constants. The lifetimes of transitions from one state to all other states are all the "same" for a single molecule. However, the rate constants can be calculated from the probability functions, the number of each transition over the total time of the state it transfers from.[20]
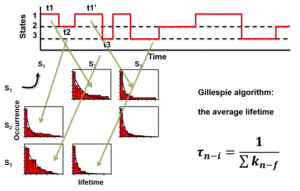
where i is the initial state, f is the final state of the transition, N is the number of these transitions in the time trajectories, n is the total number of states, k is the rate constant, t is the time of each state before the transition happens. For example, one measures 130 seconds (s) of smFRET time trajectories. The total time of a molecule stays on state one is t1 = 100 second (s), state two t2 = 20 s, and state three is t3 = 10 s. Among the 100 s the molecule stays state one, it transfers to state two 70 times and transfers to state three 30 times at the end of its dwell times, the rate constant of state 1 to state 2 is thus k12 = 70/100 = 0.7 s−1, the rate constant of state 1 to state 3 is k13 = 30/100 = 0.3 s−1. Typically the probabilities of the lengths of the 70 times or the 30 times transition (dwell times) are exponentially distributed (right figure). The average dwell times of the two distributions of state one, i.e. the two lifetimes, τ12 and τ13, are both the same at 1 s for these two transitions (right figure). The number of transitions N can be the total number of state transitions or the fitted amplitude of the exponential decay function of the accumulated histogram of the state dwell times. The latter only works for well-behaved dwell-time distributions. A system under equilibrium with each state parallel transfers to all others in first-order reactions is a special case for easier understanding. When the system is not under equilibrium, this equation still holds but care should be applied to use it.
The interpretation of the above equation is simply based on the assumption that each molecule is the same, the ergodic hypothesis. The existence of each state is just represented by its total time which is its "concentration". Thus, The rate of transition to any other state is the number of transitions normalized by this concentration. Numerically, the time concentration can be converted to number concentration to mimic an ensemble measurement.[20] Because the single molecules are the same as all other molecules, we can assume that the time trajectory is a random combination of a lot of molecules each only occupying a very short period of time, say 𝛿t. Thus, the "concentration" of the molecule at state n is cn = tn / 𝛿t. Among all these "molecules", if Nnf transfer to state f during this measuring time 𝛿t, the rate of transfer by definition is r = Nnf / 𝛿t = knf cn. Thus knf = Nnf / tn.
One can see that the single molecule measurement of the rate constant is only dependent on the ergodic hypothesis, which can be judged if a statistically enough number of single molecules are measured and expected well-behaved distributions of dwell times are observed. Heterogeneity among single molecules can be observed as well if each molecule has a distinguishable set of states or set of rate constants.
Reduce the uncertainty level
The uncertainty level of the rate analysis can be estimated from multiple experimental trials, bootstrapping analysis, and fitting error analysis. State misassignment is a common error source during the data analysis, which originates from state broadening, noise, and camera blurring. Data binning, moving average, and wavelet transform can help reduce the effect of state broadening and noise but will enhance the camera blurring effect.
The camera blurring effect can be reduced via faster sampling frequency relies on the development of a more sensitive camera, special data analysis, or both. Traditionally in HMMs, the data point before and after the transition is specially assigned to reduce the wrong assignment rate of these data points to states in between the transition. However, there is a limitation to this method to work. When the transition frequency is approaching the sampling frequency, too much data are blurred for this method to work (see above the figure of the camera blur). An experimental approach using a pulsed laser has been reported to partially overcome the camera blurring effect without a very fast camera.[21] The idea is to only illuminate a very short period in each camera collection cycle to avoid averaging of the signal in each cycle.
A two-step data analysis method has also been reported to increase the analysis accuracy for camera blurred data. The idea is to simulate a trajectory with the Monte Carlo simulation method and compare it to the experimental data. At the right condition, both the simulation and the experimental data will contain the same degree of blurring information and noise. This simulated trajectory is a better answer than the raw experimental data because its ground truth is "known". This method has open-source codes available as postFRET [22] (GitHub link [14]) and MASH-FRET.[16] This method can also slightly correct the effect of the non-Gaussian noise that has caused trouble to accurately identify the states using the statistical methods.
The current data analysis for smFRET still requires great care and special training, calling for deep-learning algorithms to play a role to free the labor in data analysis.
Advantages
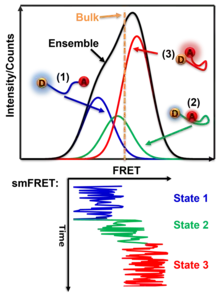
SmFRET allows for a more precise analysis of heterogeneous populations and has a few advantages when compared to ensemble FRET.
One benefit of studying distances in single molecules is that heterogeneous populations can be studied more accurately with values specific for each molecule rather than computing an average based on an ensemble. This allows for the study of specific homogeneous populations within a heterogeneous population. For example, if two existing homologous populations within a heterogeneous population have different FRET values, an ensemble FRET analysis will produce a weighted averaged FRET value to represent the population as a whole. Thus, the obtained FRET value does not produce data on the two distinct populations. In contrast, smFRET would be able to differentiate between the two populations and would allow an analysis of the existing homologous populations.[23]
SmFRET also provides dynamic temporal resolution of an individual molecule that cannot be accomplished through ensemble FRET measurements. Ensemble FRET has the ability to detect well-populated transition states that accumulate in a population, but it lacks the ability to characterize intermediates that are short-lived and do not accumulate. This limit is addressed by smFRET which offers a direct way to observe the intermediates of single molecules regardless of accumulation. When you observe a long enough time on a molecule, there will be events of the transition state that last long enough to distinguish it from noise or the broadening of other states. Therefore, smFRET demonstrates the ability to capture transient subpopulations in a heterogeneous environment.[24]
Kinetic information in a system under equilibrium is lost at the ensemble level because none of the concentrations of the reactants and products change over time. However, at the single-molecule level, the transfer between the reactants and products can happen at a measurable high rate and be balanced over time stochastically. Thus, tracing the time trajectory of a particular molecule enables the direct measurement of the rate constant of each transition step, including the intermediates that are hidden at the ensemble level due to their low concentrations. This allows smFRET to be used to study DNA, RNA, and protein’s folding dynamics. Like protein folding, DNA and RNA folding go through multiple interactions, folding pathways, and intermediates before reaching their native states.
SmFRET is also shown to utilize a three-color system better than ensemble FRET. Using two acceptor fluorophores rather than one, FRET can observe multiple sites for correlated movements and spatial changes in any complex molecule. This is shown in the research on the Holliday Junction. SmFRET with the three-color system offers insights into synchronized movements of the junction's three helical sites and the near non-existence of its parallel states. Ensemble FRET can use a three-color system as well. However, any obvious advantages are outweighed by the three-color system's requirements, including a clear separation of fluorophore signals. For a clear distinction of signal, FRET overlaps must be small but that also weakens FRET strength. SmFRET corrects its overlap limitations by using band-pass filters and dichroic mirrors which further the signal between two fluorescence acceptors and solve for any bleed-through effects.[25]
Applications
A major application of smFRET is to analyze the minute biochemical nuances that facilitate protein folding. In recent years, multiple techniques have been developed to investigate single-molecule interactions that are involved in protein folding and unfolding. Force-probe techniques, using atomic force microscopy and laser tweezers, have provided information on protein stability. smFRET allows researchers to investigate molecular interactions using fluorescence. Forster resonance energy transfer (FRET) was first applied to single molecules by Ha et al. and applied to protein folding in work by Hochstrasser, Weiss, et al. The benefit that smFRET as a whole has afforded to analyze molecular interactions is the ability to test single molecule interactions directly without having to average ensembles of data. In protein folding analysis, ensemble experiments involve taking measurements of multiple proteins that are in various states of transition between their folded and unfolded state. When averaged, the protein structure that can be inferred from the ensemble of data only provides a rudimentary structural model of protein folding. However, a true understanding of protein folding requires deciphering the sequence of structural events along the folding pathways between the folded and unfolded states. It is this particular branch of research that smFRET is highly applicable.
FRET studies calculate corresponding FRET efficiencies as a result of time-resolved observation of protein folding events. These FRET efficiencies can then be used to infer distances between molecules as a function of time. As the protein transitions between the folded and unfolded states, the corresponding distances between molecules can indicate the sequence of molecular interactions that lead to protein folding.[26]
Another application of smFRET is for DNA and RNA folding dynamics.[27] Typically, two different locations of a nucleotide are labeled with the donor and acceptor dyes. The change of distance between the two locations changes over time due to the folding and unfolding of the nucleotide plus the random diffusion of the two points over time, within each measuring window and among different windows. Due to the complexity of the folding/unfolding trajectory, it is extremely difficult to measure the process at the ensemble level. Thus, smFRET becomes a key technique in this field. On top of the challenges of smFRET data analysis, one challenge is to label multiple positions of interest, another is from the two-point dynamics to calculate the overall folding pathways.
Single-molecule FRET can also be applied to study the conformational changes of the relevant channel motifs in certain channels. For example, labeled tetrameric KirBac potassium channels were labeled with donor and acceptor fluorophores at particular sites in order to understand the structural dynamics within the lipid membrane, thus allowing them to generalize similar dynamics for similar motifs in other eukaryotic Kir channels or even cation channels in general. The use of smFRET in this experiment allows for visualization of the conformational changes that cannot be seen if the macroscopic measurements are simply averaged. This will lead to ensemble analysis rather than analysis of individual molecules and the conformational changes within, allowing us to generalize similar dynamics for similar motifs in other eukaryotic channels.
The structural dynamics of the KirBac channel has been thoroughly analyzed in both the open and closed states, dependent on the presence of the ligand PIP2. Part of the results based on smFRET demonstrated the structural rigidity of the extracellular region. The selectivity filter and the outer loop of the selectivity filter region were labeled with fluorophores and conformational coupling was observed. The individual smFRET trajectories strongly demonstrated a FRET efficiency of around 0.8 with no fluctuations, regardless of the state of the channel.[28]
Recently, single-molecule FRET has been applied to quantitatively detect target DNA and to distinguish single nucleotide polymorphism. Unlike ensemble FRET, single-molecule FRET allows real-time monitoring of target binding events. Additionally, the low background and high signal-to-noise ratio observed with the single-molecule FRET technique leads to ultra-sensitivity (detection limit in the femtomolar range) These days, different types of signal amplification steps are incorporated in order to push down the detection limit.
Limitations
Despite making approximate estimates, a limitation of smFRET is the difficulty of obtaining the correct distance involved in energy transfer. Requiring an accurate distance estimate gives rise to a major challenge because the fluorescence of the donor and acceptor fluorophores, as well as the energy transfer, is dependent on the environment and how the dyes are oriented, which can vary depending on the flexibility of where the fluorophores are bound. In addition, the actual distance of a given state can be dynamic and the measured value represents the average distance within the collection time frame. This issue, however, is not particularly relevant when the distance estimation of the two fluorophores does not need to be determined with exact and absolute precision.[6]
Extracting kinetic information from a complicated biological system with a transition rate of around a few milliseconds or below remains challenging. The current time resolutions of such measurements are typically at the millisecond level with a few reports at the microsecond level. There is a theoretical limitation to dye photophysics. The lifetime of the excited state of a typical organic dye molecule is about 1 nanosecond. In order to obtain statistical confidence of the FRET values, tens to hundreds of photons are required, which put the best possible time resolution to the order of 1 microsecond. In order to reach this limit, very strong light is required (power density in the order of 1×10¹⁰ W m−2, 107 sun typically achieved by focusing a laser beam using a microscope), which often cause photodamage to the organic molecules. Another limitation is the photobleaching lifetime of the dye, which is a function of light intensity and oxidation/reduction stress of the environment. The photobleaching lifetime of a typical organic dye under typical experimental conditions (laser power density just a few suns) is in a few seconds, or a few minutes with the help of oxygen scavenger solutions. Thus kinetic events longer than a few minutes is difficult to probe with organic dyes. Other probes with longer lifetimes such as quantum dots, polymer dots, and all-inorganic dyes have to be used instead of the organic dyes.
References
- ↑ Moerner WE, Fromm DP (2003-08-01). "Methods of single-molecule fluorescence spectroscopy and microscopy". Review of Scientific Instruments. 74 (8): 3597–3619. Bibcode:2003RScI...74.3597M. doi:10.1063/1.1589587. ISSN 0034-6748. S2CID 11615310.
- ↑ Michalet X, Colyer RA, Scalia G, Ingargiola A, Lin R, Millaud JE, Weiss S, Siegmund OH, Tremsin AS, Vallerga JV, Cheng A, Levi M, Aharoni D, Arisaka K, Villa F, Guerrieri F, Panzeri F, Rech I, Gulinatti A, Zappa F, Ghioni M, Cova S (February 2013). "Development of new photon-counting detectors for single-molecule fluorescence microscopy". Philosophical Transactions of the Royal Society of London. Series B, Biological Sciences. 368 (1611): 20120035. doi:10.1098/rstb.2012.0035. PMC 3538434. PMID 23267185.
- ↑ Ha T, Enderle T, Ogletree DF, Chemla DS, Selvin PR, Weiss S (June 1996). "Probing the interaction between two single molecules: fluorescence resonance energy transfer between a single donor and a single acceptor". Proceedings of the National Academy of Sciences of the United States of America. 93 (13): 6264–8. Bibcode:1996PNAS...93.6264H. doi:10.1073/pnas.93.13.6264. PMC 39010. PMID 8692803.
- ↑ Hellenkamp B, Wortmann P, Kandzia F, Zacharias M, Hugel T (February 2017). "Multidomain structure and correlated dynamics determined by self-consistent FRET networks". Nature Methods. 14 (2): 176–182. doi:10.1038/nmeth.4081. PMC 5289555. PMID 27918541.
- ↑ Kastantin M, Schwartz DK (December 2011). "Connecting rare DNA conformations and surface dynamics using single-molecule resonance energy transfer". ACS Nano. 5 (12): 9861–9. doi:10.1021/nn2035389. PMC 3246573. PMID 21942411.
- 1 2 Roy R, Hohng S, Ha T (June 2008). "A practical guide to single-molecule FRET". Nature Methods. 5 (6): 507–16. doi:10.1038/nmeth.1208. PMC 3769523. PMID 18511918.
- ↑ Preus S, Noer SL, Hildebrandt LL, Gudnason D, Birkedal V (July 2015). "iSMS: single-molecule FRET microscopy software". Nature Methods. 12 (7): 593–594. doi:10.1038/nmeth.3435. PMID 26125588. S2CID 30222505.
- ↑ Juette, Manuel F (February 2016). "Single-molecule imaging of non-equilibrium molecular ensembles on the millisecond timescale". Nature Methods. 13 (4): 341–344. doi:10.1038/nmeth.3769. PMC 4814340. PMID 26878382.
- ↑ Thomsen J, Sletfjerding MB, Jensen SB, Stella S, Paul B, Malle MG, et al. (November 2020). "DeepFRET, a software for rapid and automated single-molecule FRET data classification using deep learning". eLife. 9: e60404. doi:10.7554/eLife.60404. PMC 7609065. PMID 33138911.
- ↑ Hellemkamp B, Schmid S, et al. (September 2018). "Precision and accuracy of single-molecule FRET measurements-a multi-laboratory benchmark study". Nature Methods. 15 (9): 669–676. doi:10.1038/s41592-018-0085-0. PMC 6121742. PMID 30171252.
- ↑ "KinSoftChallenge - tools".
- ↑ "Inferring kinetic rate constants from single-molecule FRET trajectories – a blind benchmark of kinetic analysis tools". bioRxiv 10.1101/2021.11.23.469671.
- ↑ Götz M, Barth A, Bohr SS, Börner R, Chen J, Cordes T, Erie DA, Gebhardt C, Hadzic MC, Hamilton GL, Hatzakis NS, Hugel T, Kisley L, Lamb DC, de Lannoy C, Mahn C, Dunukara D, de Ridder D, Sanabria H, Schimpf J, Seidel CA, Sigel RK, Sletfjerding MB, Thomsen J, Vollmar L, Wanninger S, Weninger KR, Xu P, Schmid S (September 2022). "A blind benchmark of analysis tools to infer kinetic rate constants from single-molecule FRET trajectories". Nature Communications. 13 (1): 5402. Bibcode:2022NatCo..13.5402G. doi:10.1038/s41467-022-33023-3. PMC 9474500. PMID 36104339.
- 1 2 3 4 5 "GitHub - nkchenjx/PostFRET: A method to fit single-molecule FRET data with two steps to increase the accuracy". GitHub. 5 November 2020.
- ↑ Danial JS, García-Sáez AJ (October 2017). "Improving certainty in single molecule imaging". Current Opinion in Structural Biology. 46: 24–30. doi:10.1016/j.sbi.2017.04.007. PMID 28482279.
- 1 2 Börner R, Kowerko D, Hadzic MC, König SL, Ritter M, Sigel RK (2018). "Simulations of camera-based single-molecule fluorescence experiments". PLOS ONE. 13 (4): e0195277. Bibcode:2018PLoSO..1395277B. doi:10.1371/journal.pone.0195277. PMC 5898730. PMID 29652886.
- ↑ Schmid S, Goetz M, Hugel T (2016). "Single-Molecule Analysis beyond Dwell Times: Demonstration and Assessment in and out of Equilibrium". Biophysical Journal. 111 (7): 1375–1384. arXiv:1605.08612. Bibcode:2016BpJ...111.1375S. doi:10.1016/j.bpj.2016.08.023. PMC 5052450. PMID 27705761.
- ↑ "The Landes Lab STaSI FRET state finder code". GitHub. 6 March 2019.
- ↑ Shuang B, Cooper D, Taylor JN, Kisley L, Chen J, Wang W, et al. (September 2014). "Fast Step Transition and State Identification (STaSI) for Discrete Single-Molecule Data Analysis". The Journal of Physical Chemistry Letters. 5 (18): 3157–3161. doi:10.1021/jz501435p. PMC 4167035. PMID 25247055.
- 1 2 Chen J, Pyle JR, Sy Piecco KW, Kolomeisky AB, Landes CF (July 2016). "A Two-Step Method for smFRET Data Analysis". The Journal of Physical Chemistry B. 120 (29): 7128–7132. doi:10.1021/acs.jpcb.6b05697. PMID 27379815.
- ↑ Nicholson DA, Nesbitt DJ (2021). "Pushing Camera-Based Single-Molecule Kinetic Measurements to the Frame Acquisition Limit with Stroboscopic smFRET". The Journal of Physical Chemistry B. 125 (23): 6080–6089. doi:10.1021/acs.jpcb.1c01036. PMID 34097408. S2CID 235369132.
- ↑ Chen J, Pyle JR, Sy Piecco KW, Kolomeisky AB, Landes CF (July 2016). "A Two-Step Method for smFRET Data Analysis". The Journal of Physical Chemistry B. 120 (29): 7128–32. doi:10.1021/acs.jpcb.6b05697. PMID 27379815. S2CID 4782546.
- ↑ Ha T (September 2001). "Single-molecule fluorescence resonance energy transfer". Methods. 25 (1): 78–86. doi:10.1006/meth.2001.1217. PMID 11558999. S2CID 13893394.
- ↑ Hinterdorfer P, van Oijen A, eds. (2009). Handbook of single-molecule biophysics (1st ed.). Dordrecht: Springer. ISBN 978-0-387-76497-9.
- ↑ Hohng S, Joo C, Ha T (August 2004). "Single-molecule three-color FRET". Biophysical Journal. 87 (2): 1328–37. Bibcode:2004BpJ....87.1328H. doi:10.1529/biophysj.104.043935. PMC 1304471. PMID 15298935.
- ↑ Schuler B, Eaton WA (February 2008). "Protein folding studied by single-molecule FRET". Current Opinion in Structural Biology. 18 (1): 16–26. doi:10.1016/j.sbi.2007.12.003. PMC 2323684. PMID 18221865.
- ↑ Chen J, Poddar NK, Tauzin LJ, Cooper D, Kolomeisky AB, Landes CF (September 25, 2014). "Single-molecule FRET studies of HIV TAR–DNA hairpin unfolding dynamics". The Journal of Physical Chemistry B. 118 (42): 12130–12139. doi:10.1021/jp507067p. PMC 4207534. PMID 25254491.
- ↑ Wang S, Vafabakhsh R, Borschel WF, Ha T, Nichols CG (January 2016). "Structural dynamics of potassium-channel gating revealed by single-molecule FRET". Nature Structural & Molecular Biology. 23 (1): 31–36. doi:10.1038/nsmb.3138. PMC 4833211. PMID 26641713.
External links
- Nils Walter Lab, University of Michigan
- Single Molecule Analysis in real-Time (SMART) Center, University of Michigan
- Ha Laboratory, Johns Hopkins School of Medicine
- Blanchard Laboratory, Cornell University
- Schuler Research Group, University of Zurich
- Weninger Laboratory, North Carolina State University
- Kapanidis Research Group, Oxford University
- Zhuang Research Group, Harvard University
- Schwartz Research Group, CU-Boulder
- Landes Research Group, Rice University
- Chen Research Group, Ohio University
- Yang Research Group, Princeton University
- Komatsuzaki Research Group, Hokkaido University
- Weiss Research Group, UCLA
- Gonzalez Research Group, Columbia University
- Hugel Research Group, University of Freiburg