| South Dakota's at-large congressional district | |||
|---|---|---|---|
 | |||
| Representative |
| ||
| Area | 75,885 sq mi (196,540 km2) | ||
| Distribution |
| ||
| Population (2022) | 909,824[1] | ||
| Median household income | $69,728[1] | ||
| Ethnicity |
| ||
| Cook PVI | R+16[2] | ||
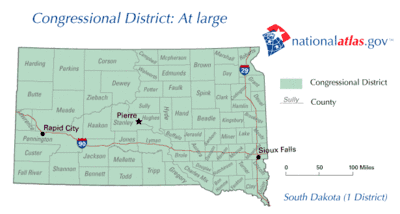
South Dakota's at-large congressional district is the sole congressional district for the state of South Dakota. Based on area, it is the fourth largest congressional district in the nation.
The district is currently represented by Dusty Johnson.
History
The district was created when South Dakota achieved statehood on November 2, 1889, electing two members at-large (statewide). Following the 1910 United States census a third seat was gained, with the legislature drawing three separate districts. The third district was eliminated after the 1930 census. As a result of the redistricting cycle after the 1980 census, the second seat was eliminated, creating a single at-large district. Since 1983, South Dakota has retained a single congressional district.
Voter registration
| Voter registration and party enrollment as of November 8, 2022 | |||||
|---|---|---|---|---|---|
| Party | Total voters | Percentage | |||
| Democratic | 151,415 | 25.34% | |||
| Republican | 296,463 | 49.65% | |||
| Libertarian | 2,801 | 0.01% | |||
| IND/NPA | 145,004 | 24.29% | |||
| Total | 597,069 | 100% | |||
Statewide election results
| Year | Office | Results |
|---|---|---|
| 2000 | President | Bush 60 - Gore 38% |
| 2004 | President | Bush 60 - Kerry 38% |
| 2008 | President | McCain 53 - Obama 45% |
| 2012 | President | Romney 58 - Obama 40% |
| 2016 | President | Trump 62 - Clinton 32% |
| 2020 | President | Trump 62 - Biden 36% |
Election history
2004 special
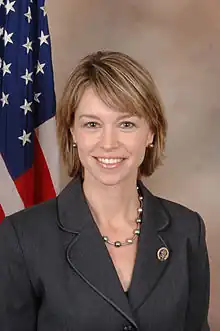
Incumbent U.S. Representative Bill Janklow resigned the seat on January 20, 2004, after he was convicted of second-degree manslaughter, triggering a special election. Democrat Stephanie Herseth was selected as the Democratic nominee for this special election and she defeated Republican Larry Diedrich with 51 percent of the vote in a close-fought election on June 1, 2004. Herseth's victory briefly gave the state its first all-Democratic congressional delegation since 1937.
2004 general
In the November general election, Herseth was elected to a full term with 53.4 percent of the vote, an increase of a few percentage points compared with the even closer June special elections. Herseth's vote margin in June was about 3,000 votes, but by November it had grown to over 29,000.
Herseth thereby became the first woman in state history to win a full term in the U.S. Congress.
Both elections were hard-fought and close compared to many House races in the rest of the United States, and the special election was watched closely by a national audience. The general election was also viewed as one of the most competitive in the country, but was overshadowed in the state by the highly competitive U.S. Senate race between Democrat Tom Daschle and Republican John Thune, which Thune narrowly won.
2006
| Party | Candidate | Votes | % | ±% | |
|---|---|---|---|---|---|
| Democratic | Stephanie Herseth Sandlin (Incumbent) | 230,468 | 69.09 | +15.73 | |
| Republican | Bruce Whalen | 97,864 | 29.34 | −16.57 | |
| Libertarian | Larry Rudebusch | 5,230 | 1.57 | +0.85 | |
| Democratic hold | Swing | ||||
| Turnout | 333,562 | ||||
2008
| Party | Candidate | Votes | % | ±% | |
|---|---|---|---|---|---|
| Democratic | Stephanie Herseth Sandlin (Incumbent) | 256,041 | 67.56 | −1.53 | |
| Republican | Chris Lien | 122,966 | 32.44 | +3.10 | |
| Democratic hold | Swing | ||||
| Turnout | 379,007 | ||||
2010
| Party | Candidate | Votes | % | ±% | |
|---|---|---|---|---|---|
| Republican | Kristi Noem | 153,703 | 48.12 | +15.68 | |
| Democratic | Stephanie Herseth Sandlin (Incumbent) | 146,589 | 45.89 | −21.67 | |
| Independent | B. Thomas Marking | 19,134 | 5.99 | +5.99 | |
| Republican gain from Democratic | Swing | ||||
| Turnout | 319,426 | ||||
2012
| Party | Candidate | Votes | % | ±% | |
|---|---|---|---|---|---|
| Republican | Kristi Noem (Incumbent) | 207,640 | 57.45 | +9.33 | |
| Democratic | Matt Varilek | 153,789 | 42.55 | −3.34 | |
| Republican hold | Swing | ||||
| Turnout | 361,429 | ||||
2014
| Party | Candidate | Votes | % | ±% | |
|---|---|---|---|---|---|
| Republican | Kristi Noem (Incumbent) | 183,834 | 66.50 | +9.05 | |
| Democratic | Corinna Robinson | 92,485 | 33.50 | −9.05 | |
| Republican hold | Swing | ||||
| Turnout | 276,319 | ||||
2016
| Party | Candidate | Votes | % | ±% | |
|---|---|---|---|---|---|
| Republican | Kristi Noem (Incumbent) | 237,163 | 64.10 | -2.4 | |
| Democratic | Paula Hawks | 132,810 | 35.90 | +2.4 | |
| Republican hold | Swing | ||||
| Turnout | 369,973 | ||||
2018
| Party | Candidate | Votes | % | ±% | |
|---|---|---|---|---|---|
| Republican | Dusty Johnson | 202,446 | 60.30 | -3.8 | |
| Democratic | Tim Bjorkman | 120,816 | 36.00 | +0.1 | |
| Republican hold | Swing | ||||
| Turnout | 323,262 | ||||
2020
| Party | Candidate | Votes | % | ±% | |
|---|---|---|---|---|---|
| Republican | Dusty Johnson (incumbent) | 321,984 | 80.96% | +20.61 | |
| Libertarian | Randy Luallin | 75,748 | 19.04% | +17.58 | |
| Total votes | 397,732 | 100.0% | |||
| Republican hold | |||||
2022
| Party | Candidate | Votes | % | ±% | |
|---|---|---|---|---|---|
| Republican | Dusty Johnson (incumbent) | 253,821 | 77.42% | –3.54 | |
| Libertarian | Collin Duprel | 74,020 | 22.58% | +3.54 | |
| Total votes | 327,841 | 100.00% | |||
| Republican hold | |||||
List of members representing the district
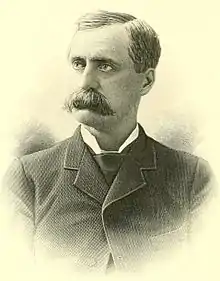
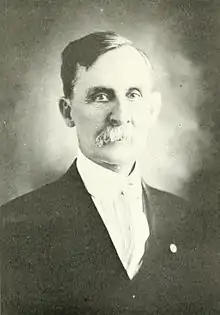
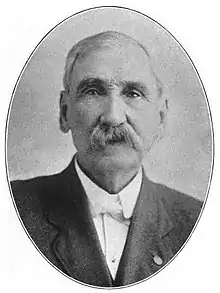
1889–1913: two seats
Two seats were created in 1889.
In 1913, the two at-large seats were replaced by three districts. There were no at-large seats, therefore, until 1983.
1983–present: one seat
By 1983, the remaining two district seats were reduced to one at-large seat.
References
- 1 2 "My Congressional District: Congressional District (at Large) (118th Congress), South Dakota". United States Census Bureau. Retrieved October 6, 2023.
- ↑ "2022 Cook PVI: District Map and List". The Cook Political Report. July 12, 2022. Retrieved January 5, 2023.
- ↑ "General Election - November 3, 2020" (PDF). Secretary of State of South Dakota. November 10, 2020. Retrieved November 12, 2020.
- ↑ "South Dakota U.S. House Election Results 2022". NBC News. November 8, 2022. Retrieved November 10, 2022.
- Martis, Kenneth C. (1989). The Historical Atlas of Political Parties in the United States Congress. New York: Macmillan Publishing Company.
- Martis, Kenneth C. (1982). The Historical Atlas of United States Congressional Districts. New York: Macmillan Publishing Company.
- Congressional Biographical Directory of the United States 1774–present

.jpg.webp)
.jpg.webp)

.jpg.webp)
.jpg.webp)
.jpg.webp)
