Greater Montreal
| |
|---|---|
 | |
| Country | Canada |
| Province | Quebec |
| Area | |
| • Total | 4,739.04 km2 (1,829.75 sq mi) |
| • Land | 4,258.31 km2 (1,644.14 sq mi) |
| Population (2021)[2] | |
| • Total | 4,291,732 |
| • Density | 1,007.85/km2 (2,610.3/sq mi) |
| Gross Metropolitan Product | |
| • Montreal CMA | CA$228.7 billion (2020) · 2nd[3] |
| Time zone | UTC−05:00 (EST) |
| • Summer (DST) | UTC−04:00 (EDT) |
| Postal code prefixes | |
| Area code(s) | 438, 450, 514, 579 |
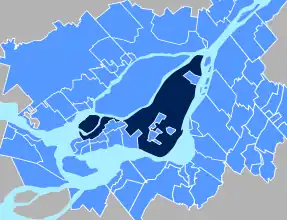 Greater Montreal shown in light blue, with the City of Montreal proper in dark blue. | |
Greater Montreal (French: Grand Montréal) is the most populous metropolitan area in Quebec and the second most populous in Canada after Greater Toronto. In 2015, Statistics Canada identified Montreal's Census Metropolitan Area (CMA) as 4,258.31 square kilometres (1,644.14 sq mi) with a population of 4,027,100,[4] almost half that of the province.
A smaller area of 3,838 square kilometres (1,482 sq mi) is governed by the Montreal Metropolitan Community (MMC) (French: Communauté métropolitaine de Montréal, CMM). This level of government is headed by a president (currently Montreal mayor Valérie Plante).
The inner ring is composed of densely populated municipalities located in close proximity to Downtown Montreal. It includes the entire Island of Montreal, Laval, and the Urban Agglomeration of Longueuil. Due to their proximity to Montreal's downtown core, some additional suburbs on the South Shore (Brossard, Saint-Lambert, and Boucherville) are usually included in the inner ring, despite their location on the mainland.
The outer ring is composed of low-density municipalities located on the fringe of Metropolitan Montreal. Most of these cities and towns are semi-rural. Specifically, the term off-island suburbs refers to those suburbs that are located on the North Shore of the Mille-Îles River, those on the South Shore that were never included in the megacity of Longueuil, and those on the Vaudreuil-Soulanges Peninsula.
Largest cities
| Rank | City | Region | Population (2016) | Land Area | Population Density | ||
|---|---|---|---|---|---|---|---|
| km2 | mi2 | /km2 | /mi2 | ||||
| 1 | Montreal | Montreal | 1,704,694 | 365.13 | 140.98 | 4,662.1 | 12,075 |
| 2 | Laval | Laval | 422,993 | 247.09 | 95.40 | 1,710.9 | 4,431 |
| 3 | Longueuil | Montérégie | 239,700 | 115.59 | 44.63 | 2,070.9 | 5,364 |
| 4 | Terrebonne | Lanaudière | 111,575 | 154.12 | 59.51 | 723.9 | 1,875 |
| 5 | Brossard | Montérégie | 85,721 | 45.20 | 17.45 | 1,895.4 | 4,909 |
| 6 | Repentigny | Lanaudière | 84,285 | 61.79 | 23.86 | 1,376.5 | 3,565 |
| 7 | Saint-Jérôme | Laurentides | 74,346 | 90.52 | 34.95 | 822.1 | 2,129 |
| 8 | Blainville | Laurentides | 56,863 | 55.10 | 21.27 | 1,030.9 | 2,670 |
| 9 | Mirabel | Laurentides | 50,513 | 485.07 | 187.29 | 104.1 | 270 |
| 10 | Dollard-des-Ormeaux | Montreal | 48,899 | 14.97 | 5.78 | 3,266.1 | 8,459 |
Cities and towns
 Montreal
 Laval
Laval Longueuil

- ↑ subdivided into nineteen boroughs
- ↑ subdivided into the boroughs of Le Vieux-Longueuil, Saint-Hubert and Greenfield Park.
Only a portion of the municipalities and MRC's located in geographical entities highlighted in light gray are part of the CMM/CMA.
There are 82 municipalities that are part of the MMC and 91 municipalities that are part of the CMA.
There are 79 municipalities that overlap between the two, with 3 municipalities being part of the MMC but not the CMA, and 12 municipalities being part of the CMA but not the MMC.[6][7]
Kanesatake and Kahnawake are not included in the previous counts.
Demographics
| Year | Pop. | ±% |
|---|---|---|
| 1871 | 174,090 | — |
| 1881 | 223,512 | +28.4% |
| 1891 | 308,169 | +37.9% |
| 1901 | 393,665 | +27.7% |
| 1911 | 594,812 | +51.1% |
| 1921 | 774,330 | +30.2% |
| 1931 | 1,064,448 | +37.5% |
| 1941 | 1,192,235 | +12.0% |
| 1951 | 1,539,308 | +29.1% |
| 1956 | 1,745,001 | +13.4% |
| 1961 | 2,110,679 | +21.0% |
| 1966 | 2,570,985 | +21.8% |
| 1971 | 2,743,208 | +6.7% |
| 1976 | 2,802,485 | +2.2% |
| 1981 | 2,862,286 | +2.1% |
| 1986 | 2,921,357 | +2.1% |
| 1991 | 3,208,970 | +9.8% |
| 1996 | 3,326,510 | +3.7% |
| 2001 | 3,426,350 | +3.0% |
| 2006 | 3,635,571 | +6.1% |
| 2011 | 3,824,221 | +5.2% |
| 2016 | 4,098,927 | +7.2% |
| 2021 | 4,291,732 | +4.7% |
| [8] | ||
Ethnicity
| Panethnic group |
2021[9][10] | 2016[11] | 2011[12] | 2006[13] | 2001[14] | |||||
|---|---|---|---|---|---|---|---|---|---|---|
| Pop. | % | Pop. | % | Pop. | % | Pop. | % | Pop. | % | |
| European[lower-alpha 1] | 3,059,895 | 72.74% | 3,070,210 | 76.57% | 2,963,860 | 78.98% | 2,980,280 | 83.05% | 2,911,230 | 86.11% |
| African | 340,140 | 8.09% | 270,940 | 6.76% | 216,310 | 5.76% | 169,065 | 4.71% | 139,305 | 4.12% |
| Middle Eastern[lower-alpha 2] | 285,615 | 6.79% | 220,055 | 5.49% | 172,345 | 4.59% | 113,405 | 3.16% | 79,410 | 2.35% |
| Latin American | 137,850 | 3.28% | 110,195 | 2.75% | 98,010 | 2.61% | 75,400 | 2.1% | 53,155 | 1.57% |
| South Asian | 121,260 | 2.88% | 85,925 | 2.14% | 79,540 | 2.12% | 70,615 | 1.97% | 57,935 | 1.71% |
| East Asian[lower-alpha 3] | 116,820 | 2.78% | 100,265 | 2.5% | 83,420 | 2.22% | 79,665 | 2.22% | 58,165 | 1.72% |
| Southeast Asian[lower-alpha 4] | 101,560 | 2.41% | 88,755 | 2.21% | 89,645 | 2.39% | 68,475 | 1.91% | 57,460 | 1.7% |
| Indigenous | 46,085 | 1.1% | 34,745 | 0.87% | 26,285 | 0.7% | 17,865 | 0.5% | 11,085 | 0.33% |
| Other[lower-alpha 5] | 40,565 | 0.96% | 28,710 | 0.72% | 23,060 | 0.61% | 13,755 | 0.38% | 12,900 | 0.38% |
| Total responses | 4,206,455 | 98.01% | 4,009,795 | 97.83% | 3,752,470 | 98.12% | 3,588,520 | 98.71% | 3,380,645 | 98.67% |
| Total population | 4,291,732 | 100% | 4,098,927 | 100% | 3,824,221 | 100% | 3,635,571 | 100% | 3,426,350 | 100% |
- Note: Totals greater than 100% due to multiple origin responses.
Language
| Language | Greater Montreal | Quebec | Canada |
|---|---|---|---|
| French | 65.9% | 79.1% | 21.4% |
| English | 13.2% | 8.9% | 58.1% |
| Arabic | 4.5% | 2.1% | 1.1% |
| Spanish | 3.2% | 1.8% | 1.3% |
| Italian | 2.7% | 1.6% | 1.3% |
| Creole | 1.5% | 0.8% | 0.2% |
| Mandarin | 1.0% | 0.1% | 1.8% |
| Greek | 1.0% | 0.5% | 0.4% |
| Romanian | 0.8% | 0.4% | 0.3% |
| Portuguese | 0.8% | 0.5% | 0.7% |
| Russian | 0.7% | 0.3% | 0.5% |
| Vietnamese | 0.7% | 0.4% | 0.5% |
| Persian (Farsi) | 0.6% | 0.3% | 0.5% |
| Cantonese | 0.6% | 0.1% | 1.7% |
| Tagalog (Filipino) | 0.5% | 0.2% | 1.2% |
| Armenian | 0.4% | 0.2% | 0.1% |
| Tamil | 0.4% | 0.2% | 0.4% |
| Punjabi (Panjabi) | 0.3% | 0.2% | 1.4% |
| Polish | 0.3% | 0.2% | 0.6% |
| Bengali | 0.3% | 0.1% | 0.2% |
| German | 0.3% | 0.2% | 1.3% |
| Urdu | 0.3% | 0.1% | 0.6% |
| Yiddish | 0.2% | 0.1% | <0.1% |
| Cambodian (Khmer) | 0.2% | 0.1% | <0.1% |
| Turkish | 0.2% | 0.1% | 0.1% |
| Gujarati | 0.2% | 0.1% | 0.3% |
| Hungarian | 0.2% | 0.1% | 0.2% |
| Bulgarian | 0.2% | 0.1% | 0.1% |
| Berber (Kabyle) | 0.2% | 0.1% | <0.1% |
| Unspecified Chinese | <0.1% | 0.1% | 0.1% |
Transportation
Exo operates the region's commuter rail and metropolitan bus services, and is the second busiest such system in Canada after Toronto's GO Transit. Established in June 2007, Exo's commuter rail system has six lines linking the downtown core with communities as far west as Hudson, as Far south as Mont-Saint-Hilaire, as far east as Mascouche, and as far north as Saint-Jérôme.
Along with Exo, a sister agency, the Autorité régionale de transport métropolitain (ARTM) plans, integrates, and coordinates public transport across Greater Montreal, including the Island of Montreal, Laval (Île Jésus), and communities along both the north shore of the Rivière des Mille-Îles and the south shore of the Saint Lawrence River. The ARTM's mandate also includes the management of reserved High-occupancy vehicle lanes, metropolitan bus terminuses, park-and-ride lots, and a budget of $163 million, which is shared amongst the transit corporations and inter-municipal public transit organizations.
The Exo/ARTM's territory spans 63 municipalities and one native reserve, 13 regional county municipalities, and 21 transit authorities. It serves a population of approximately 3.7 million people who make more than 750,000 trips daily.
The major transit commissions under the ARTM are:
- Société de transport de Montréal (English: Montreal Transit Corporation), serving the Island of Montreal
- Société de transport de Laval (English: Laval Transit Corporation), serving the city of Laval
- Réseau de transport de Longueuil (English: Longueuil Transit Network), serving the Urban agglomeration of Longueuil
Education
| Universities | CEGEPs and other colleges | Other schools |
|---|---|---|
|
(In Montreal, except where otherwise noted.)
See also
- Group 1
- Group 2
- ↑ classified as an equivalent territory
- Group 3
- ↑ in area served by the Réseau de transport métropolitain
Notes
- ↑ 2001-2016: Statistic includes all persons that did not make up part of a visible minority or an indigenous identity.
2021: Statistic includes all persons belonging to the non-indigenous and non-visible minority “White” population group. - ↑ Statistic includes total responses of "West Asian" and "Arab" under visible minority section on census.
- ↑ Statistic includes total responses of "Chinese", "Korean", and "Japanese" under visible minority section on census.
- ↑ Statistic includes total responses of "Filipino" and "Southeast Asian" under visible minority section on census.
- ↑ Statistic includes total responses of "Visible minority, n.i.e." and "Multiple visible minorities" under visible minority section on census.
References
- ↑ "Census Profile - Montreal Census Metropolitan Area". Canada 2011 Census. Statistics Canada. 8 February 2012. Archived from the original on 15 January 2016. Retrieved 9 February 2012.
- ↑ "Population and dwelling counts, for census metropolitan areas, 2016 and 2011 censuses – 100% data". Statistics Canada. Government of Canada. 8 February 2017. Archived from the original on 11 February 2017. Retrieved 14 February 2017.
- ↑ "Statistics Canada. Table 36-10-0468-01 Gross domestic product (GDP) at basic prices, by census metropolitan area (CMA) (x 1,000,000)". Statistics Canada.
- ↑ "Grand Montréal: maintenant 4 millions de personnes". journalmetro.com. 12 February 2015. Archived from the original on 20 October 2017. Retrieved 30 April 2018.
- ↑ "Population and Dwelling Count Highlight Tables, 2016 Census". 8 February 2017.
- ↑ "Communauté métropolitaine de Montréal" (PDF).
- ↑ "La CMM et les MRC périmétropolitaines" (PDF).
- ↑ "Évolution de la population de Montréal, 1660 à nos jours". Ville de Montréal. Archived from the original on 11 November 2012. Retrieved 19 November 2013.
- ↑ Government of Canada, Statistics Canada (21 September 2022). "Indigenous identity by Registered or Treaty Indian status: Canada, provinces and territories, census metropolitan areas and census agglomerations with parts". www12.statcan.gc.ca. Retrieved 10 January 2023.
- ↑ Government of Canada, Statistics Canada (26 October 2022). "Visible minority and population group by generation status: Canada, provinces and territories, census metropolitan areas and census agglomerations with parts". www12.statcan.gc.ca. Retrieved 10 January 2023.
- ↑ Government of Canada, Statistics Canada (27 October 2021). "Census Profile, 2016 Census". www12.statcan.gc.ca. Retrieved 10 January 2023.
- ↑ Government of Canada, Statistics Canada (27 November 2015). "NHS Profile". www12.statcan.gc.ca. Retrieved 10 January 2023.
- ↑ Government of Canada, Statistics Canada (20 August 2019). "2006 Community Profiles". www12.statcan.gc.ca. Retrieved 10 January 2023.
- ↑ Government of Canada, Statistics Canada (2 July 2019). "2001 Community Profiles". www12.statcan.gc.ca. Retrieved 10 January 2023.
- ↑ "Montréal, CMA, Quebec". Canada 2011 Census. Statistics Canada. 4 August 2017. Retrieved 11 December 2019.
External links
- (in French) Metropolitan Community of Montreal website
- Act respecting the Communauté métropolitaine de Montréal (provincial statute)
- Greater Montreal Area Restaurants
- (in French) Greater Montreal Area map in .pdf
| Neighbourhoods | |||
|---|---|---|---|
| Administration | |||
| Public services | |||
| Education |
| ||
| Other | |||
| |||
Great Lakes megalopolis as defined by the RPA | ||
|---|---|---|
Includes all metropolitan areas that have a population of 150,000 or greater according to the most recent national census. | ||
| Great Lakes region cities |  | |
| Surrounding cities |
| |
| Cities of states south of region | ||
| Other metro-regions | ||