| Thornbury and Yate | |
|---|---|
| County constituency for the House of Commons | |
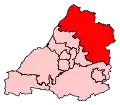
 Boundary of Thornbury and Yate in Avon | |
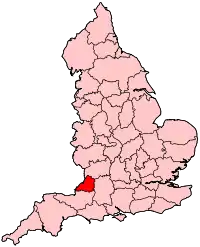
 Location of Avon within England | |
| County | South Gloucestershire |
| Electorate | 64,368 (2018)[1] |
| Major settlements | Thornbury, Yate and Chipping Sodbury |
| Current constituency | |
| Created | 2010 |
| Member of Parliament | Luke Hall (Conservative) |
| Seats | One |
| Created from | Northavon |
Thornbury and Yate is a constituency[n 1] represented in the House of Commons of the UK Parliament since the 2015 election by Luke Hall, a member of the Conservative Party.[n 2] Encompassing an area to the north-east of Bristol, it is one of three constituencies that make up the South Gloucestershire Unitary Authority Area, along with Filton and Bradley Stoke and Kingswood.
History
This seat is a successor to the former Northavon constituency, which was abolished following boundary changes taking effect at the 2010 general election.[2] It is named after the two largest towns in the constituency: Thornbury and Yate.
The constituency was one of a significant number gained from the Liberal Democrats by the Conservatives in the 2015 general election, and their majority further increased to more than 12,000 in the 2017 election, even as the Conservatives saw a net loss of seats nationally.
Boundaries
Following the Fifth Periodic Review of Westminster constituencies by the Boundary Commission this newly defined seat emerged. The electoral wards used in the creation of this new seat were all from the district of South Gloucestershire and were as follows:[2]
- Alveston
- Boyd Valley (includes Marshfield, Pucklechurch and Wick)
- Charfield
- Cromhall
- Chipping Sodbury
- Cotswold Edge (includes Hawkesbury Upton and Acton Turville)
- Dodington
- Frampton Cotterell
- Ladden Brook (includes Wickwar)
- Severn – Aust
- Thornbury North
- Thornbury South
- Westerleigh
- Yate Central
- Yate North
- Yate West
Ward names and boundaries were subsequently reconfigured by the South Gloucestershire (Electoral Changes) Order 2018[3] which came into effect in 2019.[4]
Constituency profile
Workless claimants, registered jobseekers, were in November 2012 significantly lower than the national average of 3.8%, at 1.8% of the population based on a statistical compilation by The Guardian.[5]
Members of Parliament
| Election | Member[6][7] | Party | |
|---|---|---|---|
| 2010 | Steve Webb | Liberal Democrat | |
| 2015 | Luke Hall | Conservative | |
Elections
Elections in the 2010s
| Party | Candidate | Votes | % | ±% | |
|---|---|---|---|---|---|
| Conservative | Luke Hall | 30,202 | 57.8 | +2.5 | |
| Liberal Democrats | Claire Young | 17,833 | 34.1 | +2.7 | |
| Labour | Rob Logan | 4,208 | 8.1 | -4.0 | |
| Majority | 12,369 | 23.7 | -0.2 | ||
| Turnout | 52,243 | 75.2 | +0.6 | ||
| Registered electors | 69,492 | ||||
| Conservative hold | Swing | -0.1 | |||
| Party | Candidate | Votes | % | ±% | |
|---|---|---|---|---|---|
| Conservative | Luke Hall | 28,008 | 55.3 | +14.3 | |
| Liberal Democrats | Claire Young | 15,937 | 31.4 | -6.5 | |
| Labour | Brian Mead | 6,112 | 12.1 | +4.3 | |
| Green | Iain Hamilton | 633 | 1.2 | -1.5 | |
| Majority | 12,071 | 23.9 | +20.8 | ||
| Turnout | 50,690 | 74.6 | +0.9 | ||
| Registered electors | 67,927 | +3.1 | |||
| Conservative hold | Swing | +10.4 | |||
| Party | Candidate | Votes | % | ±% | |
|---|---|---|---|---|---|
| Conservative | Luke Hall | 19,924 | 41.0 | +3.9 | |
| Liberal Democrats | Steve Webb | 18,429 | 37.9 | -14.0 | |
| UKIP | Russ Martin | 5,126 | 10.6 | +7.1 | |
| Labour | Hadleigh Roberts | 3,775 | 7.8 | +0.8 | |
| Green | Iain Hamilton | 1,316 | 2.7 | New | |
| Majority | 1,495 | 3.1 | N/A | ||
| Turnout | 48,570 | 73.7 | -1.5 | ||
| Registered electors | 65,884 | +2.8 | |||
| Conservative gain from Liberal Democrats | Swing | +8.92 | |||
| Party | Candidate | Votes | % | ±% | |
|---|---|---|---|---|---|
| Liberal Democrats | Steve Webb | 25,032 | 51.9 | -2.4 | |
| Conservative | Matthew Riddle | 17,916 | 37.2 | +6.3 | |
| Labour | Roxanne Egan | 3,385 | 7.0 | -3.9 | |
| UKIP | Jenny Knight | 1,709 | 3.5 | ||
| Independents Federation UK | Thomas Beacham | 126 | 0.3 | ||
| Independent | Anthony Clements | 58 | 0.1 | ||
| Majority | 7,116 | 14.7 | |||
| Turnout | 48,226 | 72.2 | |||
| Registered electors | 64,092 | +0.1 | |||
| Liberal Democrats win (new seat) | |||||
See also
Notes
- ↑ A county constituency (for the purposes of election expenses and type of returning officer)
- ↑ As with all constituencies, the constituency elects one Member of Parliament (MP) by the first past the post system of election at least every five years.
References
- ↑ "England Parliamentary electorates 2010-2018". Boundary Commission for England. Retrieved 23 March 2019.
- 1 2 "Final Recommendations for Parliamentary Constituency Boundaries in the Unitary Authority of South Gloucestershire". Boundary Commission for England. 15 November 2001. Archived from the original on 2 November 2009. Retrieved 24 April 2010.
- ↑ "The South Gloucestershire (Electoral Changes) Order 2018". legislation.gov.uk. Retrieved 29 March 2020.
- ↑ Wood, Alex (18 January 2018). "Everything you need to know about the South Gloucestershire boundary changes". Bristol Post. Retrieved 29 March 2020.
- ↑ Unemployment claimants by constituency The Guardian
- ↑ "Bristol North West 1950-". Parliamentary Debates (Hansard). Retrieved 2 February 2015.
- ↑ Leigh Rayment's Historical List of MPs – Constituencies beginning with "B" (part 6)
- ↑ "Parliamentary general election - 12 December 2019". South Gloucestershire Council. 5 May 2017. Retrieved 16 November 2019.
- 1 2 "Thornbury & Yate parliamentary constituency". BBC News.
- ↑ "Election Data 2015". Electoral Calculus. Archived from the original on 18 May 2015. Retrieved 17 October 2015.
- ↑ "Election Data 2010". Electoral Calculus. Archived from the original on 26 July 2013. Retrieved 17 October 2015.
- ↑ "Election 2010 – Constituency – Thornbury & Yate". BBC News.
- ↑ Percentage change and swing for 2010 is calculated relative to the PA (Rallings and Thrasher) 2005 notional result, not actual 2005 result "Press Association Elections". Press Association. Retrieved 17 July 2017.