| Washington's 2nd congressional district | |||
|---|---|---|---|
Interactive map of district boundaries since January 3, 2023 | |||
| Representative |
| ||
| Population (2022) | 782,277 | ||
| Median household income | $82,997[1] | ||
| Ethnicity |
| ||
| Cook PVI | D+9[2] | ||
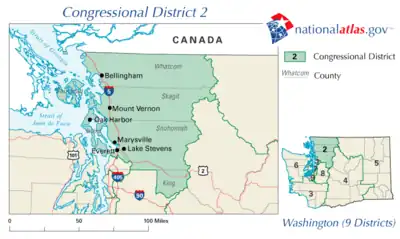
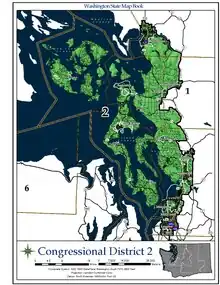
Washington's 2nd congressional district includes all of Island, San Juan, Skagit, and Whatcom counties, as well as western Snohomish County. It stretches from Bellingham and the Canada–US border in the north to Lynnwood and the King/Snohomish county line in the south. Since 2001, it has been represented by Democrat Rick Larsen.
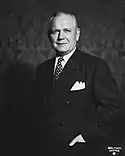
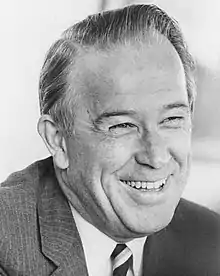
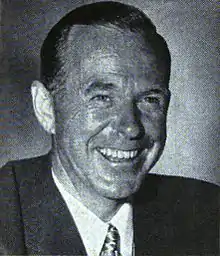
Originally created in 1909, when Washington was broken up into districts, the second district was represented by future U.S. Senator Henry M. "Scoop" Jackson between 1941 and 1953. It was a reliably Democratic district for most of the latter half of the 20th century, until the Republican Revolution of 1994, when retiring Rep. Al Swift was replaced by Jack Metcalf. Larsen has represented the district since Metcalf's retirement in 2001. He faced a close re-election in 2002, but was handily re-elected in 2004, and didn't face serious opposition until 2010. In the 2008 election, Larsen easily defeated Republican challenger Rick Bart. In the 2010 election, Larsen narrowly avoided defeat against Republican challenger John Koster.
The district has leaned Democratic in presidential elections since the 1988 election. Al Gore and John Kerry narrowly carried the district in 2000 and 2004 with 48% and 51% of the vote, respectively. In 2008, Barack Obama won the district by a wide margin, carrying 55.60% of the vote while John McCain received 42%.
Recent presidential election results
| Election results from presidential races | ||
|---|---|---|
| Year | Office | Results |
| 1952 | President | Eisenhower 55 - 45% |
| 1956 | President | Eisenhower 55 - 45% |
| 1960 | President | Kennedy 50 - 50% |
| 1964 | President | Johnson 66 - 34% |
| 1968 | President | Humphrey 48 - 46% |
| 1972 | President | Nixon 62 - 38% |
| 1976 | President | Ford 51 - 47% |
| 1980 | President | Reagan 50 - 37% |
| 1984 | President | Reagan 55 - 44% |
| 1988 | President | Dukakis 49 - 48% |
| 1992 | President | Clinton 39 - 33% |
| 1996 | President | Clinton 47 - 39% |
| 2000 | President | Gore 48 - 47% |
| 2004 | President | Kerry 51 - 47% |
| 2008 | President | Obama 56 - 42% |
| 2012 | President | Obama 59 - 38% |
| 2016 | President | Clinton 57 - 35% |
| 2020 | President | Biden 62 - 35% |
List of members representing the district
Recent election results
2010
| Party | Candidate | Votes | % | |
|---|---|---|---|---|
| Democratic | Rick Larsen (Incumbent) | 155,241 | 51.1 | |
| Republican | John Koster | 148,722 | 48.9 | |
| Total votes | 303,963 | 100.0 | ||
| Turnout | ||||
| Democratic hold | ||||
2012
| Party | Candidate | Votes | % | |
|---|---|---|---|---|
| Democratic | Rick Larsen (Incumbent) | 184,826 | 61.1 | |
| Republican | Dan Matthews | 117,465 | 38.9 | |
| Total votes | 302,291 | 100.0 | ||
| Democratic hold | ||||
2014
| Party | Candidate | Votes | % | |
|---|---|---|---|---|
| Democratic | Rick Larsen (Incumbent) | 122,173 | 60.6 | |
| Republican | B.J. Guillot | 79,518 | 39.4 | |
| Total votes | 201,691 | 100.0 | ||
| Democratic hold | ||||
2016
| Party | Candidate | Votes | % | |
|---|---|---|---|---|
| Democratic | Rick Larsen (Incumbent) | 208,314 | 64.0 | |
| Republican | Marc Hennemann | 117,094 | 36.0 | |
| Total votes | 325,408 | 100.0 | ||
| Democratic hold | ||||
2018
| Party | Candidate | Votes | % | |
|---|---|---|---|---|
| Democratic | Rick Larsen (Incumbent) | 155,009 | 72.3 | |
| Libertarian | Brian Luke | 59,314 | 27.7 | |
| Total votes | 214,323 | 100.0 | ||
| Democratic hold | ||||
2020
| Party | Candidate | Votes | % | |
|---|---|---|---|---|
| Democratic | Rick Larsen (incumbent) | 255,252 | 63.1 | |
| Republican | Timothy Hazelo | 148,384 | 36.7 | |
| Write-in | 962 | 0.2 | ||
| Total votes | 404,598 | 100.0 | ||
| Democratic hold | ||||
2022
| Party | Candidate | Votes | % | |
|---|---|---|---|---|
| Democratic | Rick Larsen (incumbent) | 202,980 | 60.1 | |
| Republican | Dan Matthews | 134,335 | 39.7 | |
| Write-in | 608 | 0.2 | ||
| Total votes | 337,923 | 100.0 | ||
| Democratic hold | ||||
Historical district boundaries
See also
- 2008 United States House of Representatives elections in Washington
- 2010 United States House of Representatives elections in Washington
- 2012 United States House of Representatives elections in Washington
- 2014 United States House of Representatives elections in Washington
- 2016 United States House of Representatives elections in Washington
References
- ↑ "My Congressional District". www.census.gov.
- ↑ "2022 Cook PVI: District Map and List". Cook Political Report. Retrieved January 5, 2023.
- 1 2 3 4 5 6 7 8 9 10 11 Biographical directory of the United States Congress : 1774-2005 ; the Continental Congress, Sept. 5, 1774 to Oct. 21, 1788, and the Congress of the United States from the First through the One Hundred Eighth Congresses, March 4, 1789 to Jan. 3, 2005 inclusive ([2005 ed., closing date of compilation, January 3, 2005] ed.). Washington, D.C.: U.S. G.P.O. 2005. ISBN 0160731763.
- ↑ "Larsen makes first visit to Whidbey as Congressman - South Whidbey Record". South Whidbey Record. Retrieved October 26, 2016.
- Martis, Kenneth C. (1989). The Historical Atlas of Political Parties in the United States Congress. New York: Macmillan Publishing Company.
- Martis, Kenneth C. (1982). The Historical Atlas of United States Congressional Districts. New York: Macmillan Publishing Company.
- Congressional Biographical Directory of the United States 1774–present
.svg.png.webp)
.jpg.webp)
.jpg.webp)
.jpg.webp)


.tif.png.webp)
_(new_version).svg.png.webp)