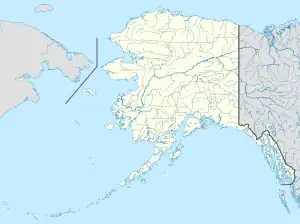
科策布 (阿拉斯加州)
科策布(英語:),是美国阿拉斯加州的一座城市。该市的人口在2000年为3082人,2010年有3201人。人口在阿拉斯加州排行第17。[1]科策布为西北-北极自治市镇的镇治。
| Kotzebue | |
|---|---|
 Kotzebue Location in Alaska | |
| 坐标:66°53′50″N 162°35′8″W | |
| 国家 | |
| 州 | 阿拉斯加州 |
| 海拔 | 26 公尺(85 英尺) |
| 人口(2010) | |
| • 總計 | 3,201人 |
| 时区 | 阿拉斯加标准时间(UTC-9) |
| • 夏时制 | 阿拉斯加夏令时间(UTC-8) |
气候
| 科策布机场(1991–2020正常值[lower-alpha 1],1922年至今极端数据) | |||||||||||||
|---|---|---|---|---|---|---|---|---|---|---|---|---|---|
| 月份 | 1月 | 2月 | 3月 | 4月 | 5月 | 6月 | 7月 | 8月 | 9月 | 10月 | 11月 | 12月 | 全年 |
| 历史最高温 °F(°C) | 40 (4) |
40 (4) |
42 (6) |
49 (9) |
74 (23) |
85 (29) |
85 (29) |
80 (27) |
69 (21) |
57 (14) |
40 (4) |
37 (3) |
85 (29) |
| 平均最高温 °F(°C) | 31.2 (−0.4) |
31.3 (−0.4) |
30.3 (−0.9) |
39.0 (3.9) |
56.4 (13.6) |
71.1 (21.7) |
74.2 (23.4) |
68.8 (20.4) |
60.1 (15.6) |
44.0 (6.7) |
32.2 (0.1) |
29.4 (−1.4) |
76.0 (24.4) |
| 平均高温 °F(°C) | 5.8 (−14.6) |
9.9 (−12.3) |
10.4 (−12.0) |
25.1 (−3.8) |
40.3 (4.6) |
54.5 (12.5) |
61.4 (16.3) |
57.8 (14.3) |
48.8 (9.3) |
32.1 (0.1) |
17.2 (−8.2) |
9.9 (−12.3) |
31.1 (−0.5) |
| 日均气温 °F(°C) | −0.7 (−18.2) |
2.7 (−16.3) |
2.8 (−16.2) |
17.6 (−8.0) |
34.4 (1.3) |
48.7 (9.3) |
56.6 (13.7) |
53.4 (11.9) |
44.3 (6.8) |
28.1 (−2.2) |
12.0 (−11.1) |
3.6 (−15.8) |
25.3 (−3.7) |
| 平均低温 °F(°C) | −7.2 (−21.8) |
−4.5 (−20.3) |
−4.8 (−20.4) |
10.0 (−12.2) |
28.5 (−1.9) |
43.0 (6.1) |
51.8 (11.0) |
48.9 (9.4) |
39.9 (4.4) |
24.1 (−4.4) |
6.9 (−13.9) |
−2.7 (−19.3) |
19.5 (−6.9) |
| 平均最低温 °F(°C) | −33.9 (−36.6) |
−31.3 (−35.2) |
−27 (−33) |
−13.9 (−25.5) |
11.0 (−11.7) |
30.3 (−0.9) |
42.1 (5.6) |
38.3 (3.5) |
28.0 (−2.2) |
5.9 (−14.5) |
−14.3 (−25.7) |
−26 (−32) |
−37.0 (−38.3) |
| 历史最低温 °F(°C) | −55 (−48) |
−52 (−47) |
−58 (−50) |
−44 (−42) |
−18 (−28) |
20 (−7) |
30 (−1) |
26 (−3) |
13 (−11) |
−19 (−28) |
−37 (−38) |
−49 (−45) |
−58 (−50) |
| 平均降水量 (mm) | 0.62 (16) |
0.85 (22) |
0.52 (13) |
0.56 (14) |
0.44 (11) |
0.60 (15) |
1.60 (41) |
2.13 (54) |
1.42 (36) |
1.07 (27) |
0.82 (21) |
0.73 (19) |
11.36 (289) |
| 平均降雪量 (cm) | 9.4 (24) |
13.1 (33) |
6.4 (16) |
4.7 (12) |
1.2 (3.0) |
0 (0) |
0 (0) |
0 (0) |
0.6 (1.5) |
5.9 (15) |
11.0 (28) |
11.9 (30) |
64.2 (163) |
| 平均降水天数(≥ 0.01 in) | 9.0 | 10.0 | 7.0 | 7.0 | 7.0 | 6.0 | 11.0 | 14.0 | 12.0 | 12.0 | 10.0 | 10.0 | 113.0 |
| 平均降雪天数(≥ 0.1 in) | 9.0 | 10.0 | 8.0 | 6.0 | 2.0 | 0.0 | 0 | 0 | 1.1 | 7.0 | 10.0 | 11.0 | 65.0 |
| 平均相對濕度(%) | 72.0 | 70.2 | 71.1 | 76.3 | 81.2 | 81.8 | 80.7 | 81.2 | 79.2 | 79.1 | 76.5 | 73.7 | 76.9 |
| 平均露点 °F(°C) | −7.1 (−21.7) |
−11.9 (−24.4) |
−6.5 (−21.4) |
5.7 (−14.6) |
25.9 (−3.4) |
37.8 (3.2) |
47.7 (8.7) |
46.2 (7.9) |
35.6 (2.0) |
17.4 (−8.1) |
2.1 (−16.6) |
−7.2 (−21.8) |
15.5 (−9.2) |
| 来源1:NOAA (relative humidity 1961–1990)[2][3][4] | |||||||||||||
| 来源2:Weather Atlas[5] | |||||||||||||
註釋
- Mean monthly maxima and minima (i.e. the highest and lowest temperature readings during an entire month or year) calculated based on data at said location from 1991 to 2020.
参考资料
- . U.S. Census Bureau. [November 18, 2011]. (原始内容存档于2006-02-08).
- . National Oceanic and Atmospheric Administration. [2020-09-01].
- . National Oceanic and Atmospheric Administration. [2020-09-01].
- . National Oceanic and Atmospheric Administration. [2020-09-01]. (原始内容存档于2023-05-04).
- . NOAA. [4 May 2021]. (原始内容存档于2021-05-05).
This article is issued from Wikipedia. The text is licensed under Creative Commons - Attribution - Sharealike. Additional terms may apply for the media files.