趋势图
趋势图(英文:),也称运行图、链图、走势图,是一类在时间序列中表达数据变量的統計圖表,屬於折線圖,通常该数据在一些工业或商业过程中可用来表达特定程序的表现。
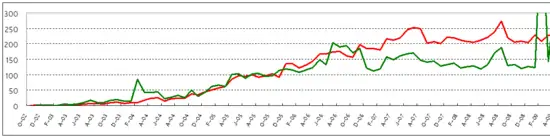
一个趋势图例子,为中文維基百科日均新增條目和編輯過百次人數,横坐标为时间,纵坐标为数量
简述
趋势图[1]为一类简易的、表达单变量数据集的统计图形。一个通常的单变量数据集假设为[2]:
- 随机抽取
- 固定分布
- 统一地点
- 统一比例

趋势图通常用于发现数据集中的异常现象,其暗示数据的变化往往是时间及其他特定因素所导致的变异性[3]。
相似的统计图形为管制图,其通常用于统计过程控制,虽然并不能显示程序的控制限制值。
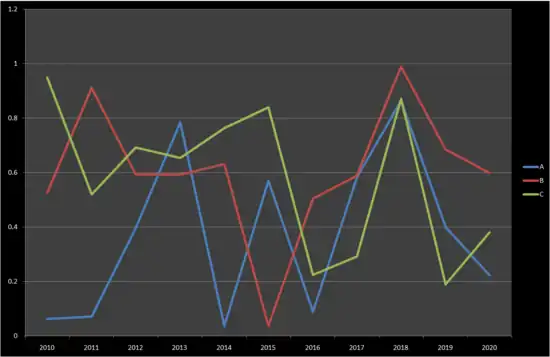
一个趋势图例子。
参考
- Chambers, John, William Cleveland, Beat Kleiner, and Paul Tukey, (1983). Graphical Methods for Data Analysis. Wadsworth.
- NIST/SEMATECH (2003). "Run-Sequence Plot" (页面存档备份,存于)In: e-Handbook of Statistical Methods 6/01/2003 (Date created).
- Chambers, John; William Cleveland, Beat Kleiner, nd Paul Tukey. . Wadsworth. 1983.
延伸阅读
- Pyzdek, Thomas. Second Edition. New York: CRC. 2003. ISBN 0-8247-4614-7.
- Chambers, John; William Cleveland, Beat Kleiner, and Paul Tukey. . Wadsworth. 1983.
This article is issued from Wikipedia. The text is licensed under Creative Commons - Attribution - Sharealike. Additional terms may apply for the media files.