人口金字塔
人口金字塔(Population pyramid),是用於表現某時間點上的年齡直方图,能反映一地區人口男女比例與年齡構成。這種表示方式顯示了年齡和性別資料,為一種可直接且清晰知曉人口組成的圖表,可以提供下列資訊:人力資源、人口老化程度、扶養比、生育年齡人口、未來的出生率和死亡率、未來人口總數等。是各類涉及人口之發展或規劃的基礎。

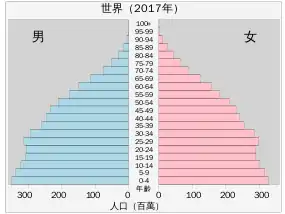
人口金字塔的範例:2017年全球的人口年齡分布,橫軸單位為百萬人。縱軸為年齡層,並作為橫軸的分界——縱軸以左為男性,以右則為女性。
人口金字塔的形狀

人口过渡模式四阶段:一、低金字塔型;二、增长;三、静止;四、缩减
每個國家的人口金字塔會呈現不同的形狀, 包括了以下三種。
- 靜止型金字塔 - 出生率与死亡率大致相等,幼龄人口在人口金字塔的比例与其他层相当。
- 擴張型金字塔 - 幼齡人口在人口金字塔的比例較其他層多。
- 縮減型金字塔 - 幼齡人口在人口金字塔的比例較其他層少或逐漸減少。
人口金字塔的這些類型,又可以和國家的發展程度做呼應,可分別拿低度發展國家,發展中國家,已開發國家是為表徵。
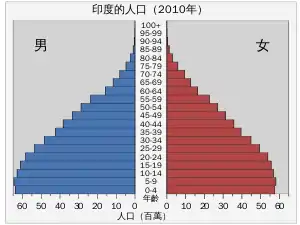
 印度人口金字塔(2010年) |
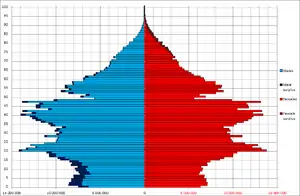
 中国人口金字塔(2010年人口普查),超過異性數量的人口以深色標示 |
外部連結
- Australian animated population pyramids, Australian Bureau of Statistics (页面存档备份,存于)
- China, Europe, USA: Population by Age and Sex, 1950-2050. Moving Age Pyramids.
- The Shape of Things to Come, Why Population Age Structure Matters To A Safer, More Equitable World (页面存档备份,存于)
- Population age structure from the US Census Bureau in an interactive Excel dashboard (页面存档备份,存于)
- Animation: a different approach to population pyramids using Excel (页面存档备份,存于)
- 中華民國人口推估(105至150年) (页面存档备份,存于)
- 依联合国人口推估计算的世界人口金字塔 (页面存档备份,存于)
This article is issued from Wikipedia. The text is licensed under Creative Commons - Attribution - Sharealike. Additional terms may apply for the media files.