| ||||||||||||||||||||||||||
| ||||||||||||||||||||||||||
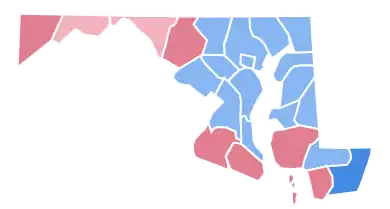 County Results
| ||||||||||||||||||||||||||
| ||||||||||||||||||||||||||
.jpg.webp)
.jpg.webp)
| Elections in Maryland |
|---|
.svg.png.webp) |
|
|
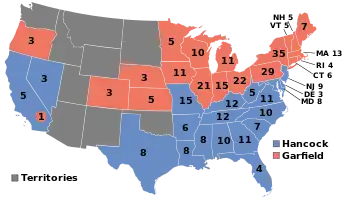
The 1880 United States presidential election in Maryland took place on November 2, 1880, as part of the 1880 United States presidential election. Voters chose eight representatives, or electors to the Electoral College, who voted for president and vice president.
Maryland voted for the Democratic nominee, Winfield Scott Hancock, over the Republican nominee, James A. Garfield by a margin of 8.82%.
In this election, Maryland voted 8.89% more Democratic than the nation at-large.[1]
Results
| 1880 United States presidential election in Maryland[2] | ||||||||
|---|---|---|---|---|---|---|---|---|
| Party | Candidate | Running mate | Popular vote | Electoral vote | ||||
| Count | % | Count | % | |||||
| Democratic | Winfield Scott Hancock of Pennsylvania | William Hayden English of Maryland | 93,706 | 54.41% | 8 | 100.00% | ||
| Republican | James Abram Garfield of Ohio | Chester Alan Arthur of New York | 78,515 | 45.59% | 0 | 0.00% | ||
| Total | 172,221 | 100.00% | 8 | 100.00% | ||||
Results by county
| County | Winfield S. Hancock
Democratic |
James A. Garfield
Republican |
James Baird Weaver
Greenback |
Margin | Total
Votes Cast [3] | ||||
|---|---|---|---|---|---|---|---|---|---|
| # | % | # | % | # | % | # | % | ||
| Allegany | 3083 | 45.86% | 3338 | 49.65% | 302 | 4.49% | -255 | -3.79% | 672 |
| Anne Arundel | 2754 | 52.92% | 2450 | 47.08% | 0 | 0.00% | 304 | 5.84% | 5204 |
| Baltimore (City) | 32672 | 58.19% | 3338 | 41.57% | 133 | 0.24% | 9334 | 16.63% | 3677 |
| Baltimore (County) | 7321 | 57.68% | 5351 | 42.16% | 21 | 0.17% | 1970 | 15.52% | 12693 |
| Calvert | 1100 | 54.67% | 912 | 45.33% | 0 | 0.00% | 188 | 9.34% | 2012 |
| Caroline | 1429 | 54.17% | 1209 | 45.83% | 0 | 0.00% | 220 | 8.34% | 2638 |
| Carroll | 3492 | 52.34% | 3138 | 47.03% | 42 | 0.63% | 354 | 53.1% | 6672 |
| Cecil | 2984 | 52.67% | 2673 | 47.18% | 9 | 0.16% | 311 | 5.49% | 5666 |
| Charles | 1686 | 47.08% | 1889 | 52.75% | 6 | 0.17% | -203 | -5.67% | 3581 |
| Dorchester | 2133 | 48.25% | 2241 | 50.69% | 47 | 1.06% | -108 | -2.44% | 4421 |
| Frederick | 5278 | 47.73% | 5764 | 52.13% | 16 | 0.14% | -486 | -4.40% | 11058 |
| Garrett | 1124 | 46.99% | 1210 | 50.59% | 58 | 2.42% | -86 | -3.60% | 2392 |
| Harford | 3016 | 54.92% | 2476 | 45.08% | 0 | 0.00% | 540 | 9.83% | 5492 |
| Howard | 1787 | 56.69% | 1365 | 43.31% | 0 | 0.00% | 422 | 13.39% | 3152 |
| Kent | 1969 | 51.52% | 1853 | 48.48% | 0 | 0.00% | 116 | 3.04% | 3822 |
| Montgomery | 3126 | 55.59% | 2497 | 44.41% | 0 | 0.00% | 629 | 11.19% | 5623 |
| Prince George's | 2713 | 50.17% | 2672 | 49.41% | 23 | 0.43% | 41 | 0.76% | 5408 |
| Queen Anne's | 2307 | 58.07% | 1666 | 41.93% | 0 | 0.00% | 651 | 16.13% | 3973 |
| St. Mary's | 1530 | 46.31% | 1772 | 53.63% | 2 | 0.06% | -242 | -7.32% | 3304 |
| Somerset | 1710 | 47.54% | 1883 | 52.35% | 4 | 0.11% | -173 | -4.81% | 3597 |
| Talbot | 2148 | 51.93% | 1988 | 48.07% | 0 | 0.00% | 160 | 3.87% | 4136 |
| Washington | 4030 | 49.06% | 4080 | 49.67% | 104 | 1.27% | -50 | -0.61% | 8214 |
| Wicomico | 2058 | 59.69% | 1348 | 39.10% | 42 | 1.22% | 710 | 20.59% | 3448 |
| Worcester | 2256 | 61.35% | 1402 | 38.13% | 19 | 0.52% | 854 | 23.23% | 3677 |
| Total | 93706 | 54.41% | 78515 | 45.59% | 828 | 172221 | |||
Counties that flipped from Republican to Democratic
Counties that flipped from Democratic to Republican
See also
References
- ↑ "Dave Leip's Atlas of U.S. Presidential Elections". uselectionatlas.org. Retrieved April 23, 2023.
- ↑ "1880 Presidential General Election Results - Maryland".
- ↑ "County Project (WIP)". Google Docs. Retrieved November 1, 2022.
This article is issued from Wikipedia. The text is licensed under Creative Commons - Attribution - Sharealike. Additional terms may apply for the media files.