| ||||||||||||||||||||||||||
| ||||||||||||||||||||||||||
 Parish Results
Smith 50-60% 60-70% 70-80% 80-90% 90-100%
| ||||||||||||||||||||||||||
| ||||||||||||||||||||||||||


| Elections in Louisiana |
|---|
 |
|
|
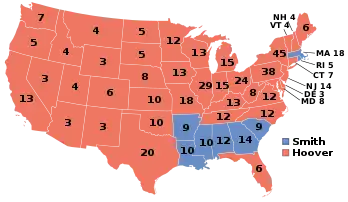
The 1928 United States presidential election in Louisiana took place on November 6, 1928, as part of the wider United States presidential election. Voters chose ten representatives, or electors, to the Electoral College, who voted for president and vice president.
Ever since the passage of a new constitution in 1898, Louisiana had been a one-party state dominated by the Democratic Party. The Republican Party became moribund due to the disenfranchisement of blacks and the complete absence of other support bases as the Pelican State completely lacked upland or German refugee whites opposed to secession.[1] Despite this absolute single-party dominance, non-partisan tendencies remained strong among wealthy sugar planters in Acadiana and within the business elite of New Orleans.[2]
Following disfranchisement, the state’s politics became dominated by a coalition of the New Orleans-based Choctaw Club of Louisiana and Black Belt cotton planters.[3] Opposition began to emerge with the Socialist Party in the lumbering parishes of the northern hills and Imperial Calcasieu in the late 1900s, and more seriously with the Progressive movement, chiefly in the southern sugar-growing parishes, in the 1910s. Conflicts with President Wilson’s Underwoood-Simmons Act[4] allowed a Progressive Party member in Whitmell P. Martin[lower-alpha 1] to be elected to the Third Congressional District in 1914, and in 1920 the racially less hardline[5] Acadiana parishes turned to Republican candidate Warren G. Harding[6] over disagreements on foreign policy and the Nineteenth Amendment.[7] Continued opposition to the Choctaws would elect the reformer John M. Parker, originally part of Theodore Roosevelt’s Bull Moose Party, as governor at the beginning of 1920; however, Parker did not deliver the promised reforms and Choctaw control returned temporarily with the 1924 election of Henry L. Fuqua.[8]
Unlike other Southern states, Louisiana’s delegates to the Democratic National Convention largely backed Catholic New York Governor Al Smith, who was opposed in the remainder of the South for his religion and opposition to Prohibition.[9] At the same time, the moribund state Republican Party — like those of Mississippi and South Carolina entirely a vehicle for Federal patronage — was undergoing a “lily white” takeover from Walter Cohen’s black-and-tans, although blacks were not expelled as occurred in Alabama, North Carolina or Virginia.[10]
Unlike the Outer South, Louisiana Democrats were controlled by fears that Republican nominee and former Secretary of Commerce Herbert Hoover supported social equality between the white and black races.[9] Although in the Protestant north and Florida Parishes there was opposition to Smith’s religion and views on Prohibition, this was overshadowed by the desire for loyalty to the one-party system as an instrument of racial control and White supremacy,[11] a viewpoint loudly supported by newly elected Governor Huey P. Long.[9] Moreover, identification with Smith’s Catholicism was extremely strong in the previously rebellious Acadiana parishes whose commitment to white supremacy was less intense.[12]
Consequently Smith and Arkansas Senator Joseph Taylor Robinson won Louisiana with 76.29 percent of the popular vote to the 23.70 percent for Hoover and Senate Majority Leader Charles Curtis of Kansas. Only in two parishes — Livingston and Washington, both proximate to the deeply anti-Catholic Pine Belt of Mississippi and western Florida Panhandle — did Hoover pass forty percent of the vote, whilst in many Acadian parishes the GOP share fell by over thirty points. Louisiana was Smith's third strongest state after South Carolina and Mississippi.[13]
Results
| Party | Candidate | Votes | % | |
|---|---|---|---|---|
| Democratic | Alfred E. Smith | 164,655 | 76.29% | |
| Republican | Herbert Hoover | 51,160 | 23.70% | |
| Write-ins | — | 18 | 0.01% | |
| Total votes | 215,833 | 100% | ||
Results by parish
| Parish | Alfred Emmanuel Smith Democratic |
Herbert Clark Hoover Republican |
Various candidates Write-ins |
Margin | Total votes cast | ||||
|---|---|---|---|---|---|---|---|---|---|
| # | % | # | % | # | % | # | % | ||
| Acadia | 3,633 | 77.23% | 1,071 | 22.77% | 2,562 | 54.46% | 4,704 | ||
| Allen | 1,308 | 64.34% | 725 | 35.66% | 583 | 28.68% | 2,033 | ||
| Ascension | 1,402 | 76.28% | 436 | 23.72% | 966 | 52.56% | 1,838 | ||
| Assumption | 948 | 75.54% | 307 | 24.46% | 641 | 51.08% | 1,255 | ||
| Avoyelles | 2,896 | 87.36% | 419 | 12.64% | 2,477 | 74.72% | 3,315 | ||
| Beauregard | 1,513 | 76.38% | 468 | 23.62% | 1,045 | 52.75% | 1,981 | ||
| Bienville | 1,301 | 78.00% | 367 | 22.00% | 934 | 56.00% | 1,668 | ||
| Bossier | 1,187 | 84.07% | 225 | 15.93% | 962 | 68.13% | 1,412 | ||
| Caddo | 6,934 | 65.42% | 3,665 | 34.58% | 3,269 | 30.84% | 10,599 | ||
| Calcasieu | 3,532 | 63.85% | 1,997 | 36.10% | 3 | 0.05% | 1,535 | 27.75% | 5,532 |
| Caldwell | 802 | 73.58% | 288 | 26.42% | 514 | 47.16% | 1,090 | ||
| Cameron | 390 | 90.49% | 41 | 9.51% | 349 | 80.97% | 431 | ||
| Catahoula | 710 | 67.55% | 341 | 32.45% | 369 | 35.11% | 1,051 | ||
| Claiborne | 1,560 | 86.24% | 249 | 13.76% | 1,311 | 72.47% | 1,809 | ||
| Concordia | 591 | 81.63% | 133 | 18.37% | 458 | 63.26% | 724 | ||
| De Soto | 1,445 | 73.57% | 517 | 26.32% | 2 | 0.10% | 928 | 47.25% | 1,964 |
| East Baton Rouge | 4,575 | 60.44% | 2,995 | 39.56% | 1,580 | 20.87% | 7,570 | ||
| East Carroll | 436 | 77.03% | 130 | 22.97% | 306 | 54.06% | 566 | ||
| East Feliciana | 622 | 79.54% | 160 | 20.46% | 462 | 59.08% | 782 | ||
| Evangeline | 1,873 | 86.19% | 300 | 13.81% | 1,573 | 72.39% | 2,173 | ||
| Franklin | 1,141 | 69.87% | 492 | 30.13% | 649 | 39.74% | 1,633 | ||
| Grant | 1,023 | 66.95% | 505 | 33.05% | 518 | 33.90% | 1,528 | ||
| Iberia | 2,561 | 86.11% | 413 | 13.89% | 2,148 | 72.23% | 2,974 | ||
| Iberville | 1,630 | 85.43% | 278 | 14.57% | 1,352 | 70.86% | 1,908 | ||
| Jackson | 907 | 100.00% | 0 | 0.00% | 907 | 100.00% | 907 | ||
| Jefferson | 5,326 | 87.77% | 742 | 12.23% | 4,584 | 75.54% | 6,068 | ||
| Jefferson Davis | 1,703 | 60.33% | 1,120 | 39.67% | 583 | 20.65% | 2,823 | ||
| Lafayette | 3,197 | 84.38% | 592 | 15.62% | 2,605 | 68.75% | 3,789 | ||
| Lafourche | 1,994 | 89.14% | 243 | 10.86% | 1,751 | 78.27% | 2,237 | ||
| LaSalle | 881 | 66.19% | 450 | 33.81% | 431 | 32.38% | 1,331 | ||
| Lincoln | 1,041 | 60.84% | 670 | 39.16% | 371 | 21.68% | 1,711 | ||
| Livingston | 1,047 | 51.78% | 975 | 48.22% | 72 | 3.56% | 2,022 | ||
| Madison | 318 | 67.80% | 151 | 32.20% | 167 | 35.61% | 469 | ||
| Morehouse | 840 | 71.19% | 340 | 28.81% | 500 | 42.37% | 1,180 | ||
| Natchitoches | 2,099 | 79.96% | 526 | 20.04% | 1,573 | 59.92% | 2,625 | ||
| Orleans | 55,919 | 79.49% | 14,424 | 20.51% | 41,495 | 58.99% | 70,343 | ||
| Ouachita | 2,739 | 66.50% | 1,380 | 33.50% | 1,359 | 32.99% | 4,119 | ||
| Plaquemines | 1,056 | 91.51% | 98 | 8.49% | 958 | 83.02% | 1,154 | ||
| Pointe Coupee | 1,330 | 92.88% | 102 | 7.12% | 1,228 | 85.75% | 1,432 | ||
| Rapides | 4,470 | 64.19% | 2,494 | 35.81% | 1,976 | 28.37% | 6,964 | ||
| Red River | 891 | 73.09% | 317 | 26.00% | 11 | 0.90% | 574 | 47.09% | 1,219 |
| Richland | 1,083 | 81.74% | 242 | 18.26% | 841 | 63.47% | 1,325 | ||
| Sabine | 1,414 | 65.80% | 735 | 34.20% | 679 | 31.60% | 2,149 | ||
| Saint Bernard | 2,359 | 96.84% | 77 | 3.16% | 2,282 | 93.68% | 2,436 | ||
| Saint Charles | 1,116 | 91.18% | 108 | 8.82% | 1,008 | 82.35% | 1,224 | ||
| Saint Helena | 609 | 80.77% | 145 | 19.23% | 464 | 61.54% | 754 | ||
| Saint James | 1,486 | 92.07% | 128 | 7.93% | 1,358 | 84.14% | 1,614 | ||
| Saint John the Baptist | 971 | 89.16% | 118 | 10.84% | 853 | 78.33% | 1,089 | ||
| Saint Landry | 3,394 | 82.54% | 718 | 17.46% | 2,676 | 65.08% | 4,112 | ||
| Saint Martin | 1,892 | 88.66% | 242 | 11.34% | 1,650 | 77.32% | 2,134 | ||
| Saint Mary | 1,754 | 74.35% | 605 | 25.65% | 1,149 | 48.71% | 2,359 | ||
| Saint Tammany | 1,811 | 65.71% | 945 | 34.29% | 866 | 31.42% | 2,756 | ||
| Tangipahoa | 2,834 | 66.70% | 1,415 | 33.30% | 1,419 | 33.40% | 4,249 | ||
| Tensas | 350 | 78.48% | 96 | 21.52% | 254 | 56.95% | 446 | ||
| Terrebonne | 1,642 | 85.97% | 268 | 14.03% | 1,374 | 71.94% | 1,910 | ||
| Union | 1,085 | 71.90% | 422 | 27.97% | 2 | 0.13% | 663 | 43.94% | 1,509 |
| Vermilion | 2,580 | 85.12% | 451 | 14.88% | 2,129 | 70.24% | 3,031 | ||
| Vernon | 2,191 | 81.42% | 500 | 18.58% | 1,691 | 62.84% | 2,691 | ||
| Washington | 2,020 | 56.93% | 1,528 | 43.07% | 492 | 13.87% | 3,548 | ||
| Webster | 1,430 | 80.07% | 356 | 19.93% | 1,074 | 60.13% | 1,786 | ||
| West Baton Rouge | 608 | 88.63% | 78 | 11.37% | 530 | 77.26% | 686 | ||
| West Carroll | 673 | 75.87% | 214 | 24.13% | 459 | 51.75% | 887 | ||
| West Feliciana | 421 | 82.39% | 90 | 17.61% | 331 | 64.77% | 511 | ||
| Winn | 1,161 | 68.54% | 533 | 31.46% | 628 | 37.07% | 1,694 | ||
| Totals | 164,655 | 76.29% | 51,160 | 23.70% | 18 | 0.01% | 113,495 | 52.58% | 215,833 |
See also
Notes
- ↑ Martin would join the Democratic Party in 1919.
References
- ↑ Phillips, Kevin P. The Emerging Republican Majority. pp. 208, 210. ISBN 9780691163246.
- ↑ Schott, Matthew J. (Summer 1979). "Progressives against Democracy: Electoral Reform in Louisiana, 1894-1921". Louisiana History: The Journal of the Louisiana Historical Association. 20 (3): 247–260.
- ↑ Wall, Bennett H.; Rodriguez, John C. Louisiana: A History. pp. 274–275. ISBN 1118619293.
- ↑ Collin, Richard H. (Winter 1971). "Theodore Roosevelt's Visit to New Orleans and the Progressive Campaign of 1914". Louisiana History: The Journal of the Louisiana Historical Association. 12 (1): 5–19.
- ↑ Howard, Perry H. (1954). "A New Look at Reconstruction". Political Tendencies in Louisiana, 1812-1952; An Ecological Analysis of Voting Behavior (Thesis). LSU Historical Dissertations and Theses. pp. 112–113. OCLC 8115.
- ↑ Phillips. The Emerging Republican Majority, p. 268
- ↑ Wall and Rodriguez. Louisiana: A History, p. 277
- ↑ Sindler, Allan P. (1956). Huey Long's Louisiana: State Politics, 1920-1952. Baltimore: Johns Hopkins University Press. pp. 40–41.
- 1 2 3 Wingo, Barbara C. (Autumn 1977). "The 1928 Presidential Election in Louisiana". Louisiana History: The Journal of the Louisiana Historical Association. Louisiana Historical Association. 18 (4): 405–435.
- ↑ Fairclough, Adam (2008). Race and Democracy: The Civil Rights Struggle in Louisiana, 1915-1972. Athens, Georgia: University of Georgia Press. p. 11. ISBN 0820331147.
- ↑ Phillips. The Emerging Republican Majority', p. 212
- ↑ Phillips. The Emerging Republican Majority, pp. 214, 268-269
- ↑ "1928 Presidential Election Statistics". Dave Leip’s U.S. Election Atlas.
- ↑ "1928 Presidential General Election Results — Louisiana". Dave Leip’s U.S. Election Atlas.
- ↑ "LA US President Race, November 06, 1928". Our Campaigns.