| |||||||||||||||||||||||||||||||
All 30 seats to the House of Assembly | |||||||||||||||||||||||||||||||
|---|---|---|---|---|---|---|---|---|---|---|---|---|---|---|---|---|---|---|---|---|---|---|---|---|---|---|---|---|---|---|---|
| |||||||||||||||||||||||||||||||
| |||||||||||||||||||||||||||||||
The 1948 Tasmanian state election was held on 21 August 1948 in the Australian state of Tasmania to elect 30 members of the Tasmanian House of Assembly. The election used the Hare-Clark proportional representation system[1] — six members were elected from each of five electorates.
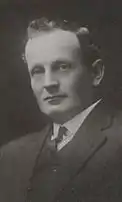
In December 1947, Labor leader Robert Cosgrove had stood down as Premier while he faced charges of bribery, corruption and conspiracy. Cosgrove was acquitted of all charges on 22 February 1948, and was re-elected as Premier by the caucus, taking over from Edward Brooker who had filled in for him for three months. Brooker died on 18 June, four months after handing the premiership back to Cosgrove, and two months prior to the 1948 election.[2]
On 8 July, the Legislative Council voted to grant the House of Assembly two months supply provided an election was called after that time. The election was fought mainly on constitutional issues.[2]
Labor lost its slender one seat majority, winning 15 seats out of 30, although they regained government and Cosgrove remained as Premier after receiving the support of one of the Independent members, Bill Wedd.[2]
Results
|
Tasmanian state election, 21 August 1948 | ||||||
|---|---|---|---|---|---|---|
| Enrolled voters | 161,088 | |||||
| Votes cast | 148,588 | Turnout | 92.24% | +1.17% | ||
| Informal votes | 5,866 | Informal | 3.95% | –6.13% | ||
| Summary of votes by party | ||||||
| Party | Primary votes | % | Swing | Seats | Change | |
| Labor | 70,476 | 49.38% | –1.59% | 15 | – 1 | |
| Liberal | 54,010 | 37.84% | +3.59% | 12 | ± 0 | |
| Ind. Lib. | 9,729 | 6.82% | –1.96% | 1 | ± 0 | |
| Independent | 8,330 | 5.84% | –0.17% | 2 | + 1 | |
| Total | 142,722 | 30 | ||||
Distribution of votes
Primary vote by division
| Bass | Darwin | Denison | Franklin | Wilmot | |
|---|---|---|---|---|---|
| Labor Party | 55.9% | 47.7% | 44.5% | 47.8% | 51.7% |
| Liberal Party | 44.1% | 45.7% | 20.9% | 33.8% | 45.8% |
| Other | – | 6.6% | 34.6% | 18.4% | 2.5% |
Distribution of seats
See also
References
- ↑ House of Assembly Elections, Parliament of Tasmania.
- 1 2 3 W. A. Townsley, Cosgrove, Sir Robert (1884 - 1969), Australian Dictionary of Biography, Volume 13, Melbourne University Press, 1993, pp 505-507.
External links
- Assembly Election Results, 1948, Parliament of Tasmania.
- Report on Parliamentary Elections, 1949, Tasmanian Electoral Commission.

