| ||||||||||||||||||||||||||
| ||||||||||||||||||||||||||
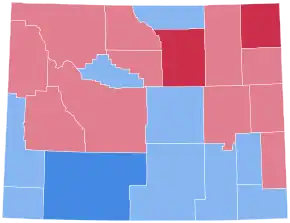
 County Results
| ||||||||||||||||||||||||||
| ||||||||||||||||||||||||||
| Elections in Wyoming |
|---|
 |
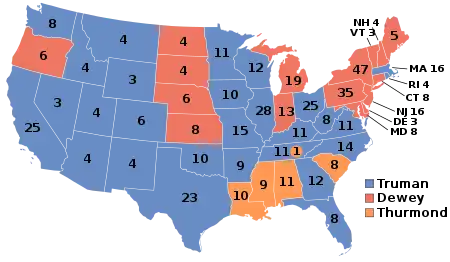
The 1948 United States presidential election in Wyoming took place on November 2, 1948, as part of the 1948 United States presidential election. State voters chose three representatives, or electors, to the Electoral College, who voted for president and vice president. Wyoming was won by incumbent Democratic President Harry S. Truman, running with Senate Majority Leader Alben W. Barkley, with 51.62 percent of the popular vote, against the Republican nominee, 47th Governor of New York Thomas E. Dewey, running with California Governor and future Chief Justice of the United States Earl Warren, with 47.27 percent of the popular vote, despite the fact that Dewey had previously won the state four years earlier.[1]
Truman's upset victory in Wyoming was part of a major upset victory nationwide, as prior to the election, polls had forecasted a Dewey victory. Dewey ran a low risk campaign, largely avoiding criticizing Truman, which was due to many believing his hawkish campaign 4 years earlier had cost him the election to Truman's Democratic predecessor, Franklin D. Roosevelt. Truman suffered from low approval ratings and dealt with many southern Democratic voters defecting to the Dixiecrat candidate Strom Thurmond, costing him the traditionally Democratic strongholds of South Carolina, Alabama, Mississippi, and Louisiana, however Truman's unexpected strength in the Midwest and West Coast secured his reelection, as he flipped the states of Ohio, Iowa, Wisconsin, Colorado, and Wyoming, all of which had voted for Dewey in 1944. Dewey revived Republican strength in the traditionally Republican Northeast, flipping Delaware, Maryland, Pennsylvania, New Jersey, Connecticut, New Hampshire, and his home state of New York. He also managed to flip Michigan and Oregon.
Truman was popular among rural voters, and with agriculture being one of the biggest parts of Wyoming's economy, Truman's support for New Deal era programs that attempted to provide relieft to farmers, which along with The Civilian Conservation Corps program greatly impacted Wyoming, allowing new National Parks to be built in the state, was popular among Wyoming voters, and he successfully painted Dewey as more conservative than he was, ignoring the fact that he was significantly more liberal and supportive of New Deal programs like Social Security than many of the conservative Congressional Republicans such as Senator Robert Taft from Ohio. Truman blamed the Republican-controlled Congress for his inability to pass legislation, which voters believed, and on election day, voters delivered Truman a landslide victory, and returned control of both chambers of Congress to the Democrats. This change was reflected in Wyoming, as the state's Class II Senate seat would flip into Democratic hands with Lester Hunt's landslide victory, who outperformed the top of the ticket by 9.9%. Truman flipped Platte and Natrona counties, outperforming Roosevelt's 1944 statewide result by 6.8%.
With a nationwide vote total of 49.6% and a vote total of 51.6% in Wyoming, as of The 2020 Presidential Election, this is the last time in which Wyoming voted more Democratic than the national average; the state is now heavily Republican, and even in this election the state technically voted 0.15% to the right of the nation. In fact, Wyoming would only support a Democratic presidential nominee one more time, during Lyndon B. Johnson's 1964 landslide. This would also be the last time that Wyoming was decided by a single-digit margin until 1992, and the state has voted by double-digit margins for the Republican nominee from 1996 onwards.
Dewey won the state in 1944 by a 2.46% margin, or 2,502 votes. However, in this election, Truman won the state, by 4.35%, or 4,407 votes. This was the last time a Democratic presidential candidate won the state until Lyndon B. Johnson in 1964, as throughout the 50s, the state transformed into a Republican stronghold. Since 1964, no Democratic presidential candidate has carried the state, and as a matter of fact, since 1964, no Democrat has even been able to reach 40% of the vote.[2]
Results

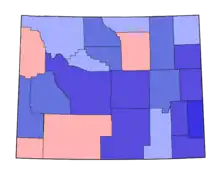
Democratic +0-5 +5-10 +10-20 +20-25% Republican +1-5%
| Party | Candidate | Votes | % | |
|---|---|---|---|---|
| Democratic | Harry S. Truman (incumbent) | 52,354 | 51.62% | |
| Republican | Thomas E. Dewey | 47,947 | 47.27% | |
| Progressive | Henry A. Wallace | 931 | 0.92% | |
| Socialist | Norman Thomas | 137 | 0.14% | |
| Socialist Labor | Edward Teichert | 56 | 0.06% | |
| Total votes | 101,425 | 100.00% | ||
Results by county
| County | Harry S. Truman[3] Democratic |
Thomas Edmund Dewey[3] Republican |
Henry Agard Wallace[4] Progressive |
Norman Mattoon Thomas[5] Socialist |
Edward A. Teichert[5] Socialist Labor |
Margin | Total votes cast | ||||||
|---|---|---|---|---|---|---|---|---|---|---|---|---|---|
| # | % | # | % | # | % | # | % | # | % | # | % | ||
| Albany | 3,141 | 51.96% | 2,858 | 47.28% | 30 | 0.50% | 12 | 0.20% | 4 | 0.07% | 283 | 4.68% | 6,045 |
| Big Horn | 2,370 | 49.14% | 2,429 | 50.36% | 20 | 0.41% | 2 | 0.04% | 2 | 0.04% | -59 | -1.22% | 4,823 |
| Campbell | 856 | 41.33% | 1,201 | 57.99% | 13 | 0.63% | 1 | 0.05% | 0 | 0.00% | -345 | -16.66% | 2,071 |
| Carbon | 3,439 | 59.16% | 2,319 | 39.89% | 55 | 0.95% | 0 | 0.00% | 0 | 0.00% | 1,120 | 19.27% | 5,813 |
| Converse | 996 | 42.60% | 1,327 | 56.76% | 11 | 0.47% | 2 | 0.09% | 2 | 0.09% | -331 | -14.16% | 2,338 |
| Crook | 712 | 37.63% | 1,166 | 61.63% | 9 | 0.48% | 3 | 0.16% | 2 | 0.11% | -454 | -24.00% | 1,892 |
| Fremont | 3,019 | 47.17% | 3,357 | 52.45% | 24 | 0.38% | 0 | 0.00% | 0 | 0.00% | -338 | -5.28% | 6,400 |
| Goshen | 1,843 | 47.15% | 2,029 | 51.91% | 34 | 0.87% | 3 | 0.08% | 0 | 0.00% | -186 | -4.76% | 3,909 |
| Hot Springs | 928 | 52.61% | 791 | 44.84% | 42 | 2.38% | 2 | 0.11% | 1 | 0.06% | 137 | 7.77% | 1,764 |
| Johnson | 682 | 33.35% | 1,351 | 66.06% | 7 | 0.34% | 5 | 0.24% | 0 | 0.00% | -669 | -32.71% | 2,045 |
| Laramie | 8,226 | 56.64% | 6,200 | 42.69% | 64 | 0.44% | 26 | 0.18% | 8 | 0.06% | 2,026 | 13.95% | 14,524 |
| Lincoln | 1,925 | 51.50% | 1,730 | 46.28% | 83 | 2.22% | 0 | 0.00% | 0 | 0.00% | 195 | 5.22% | 3,738 |
| Natrona | 6,183 | 53.26% | 5,341 | 46.01% | 62 | 0.53% | 20 | 0.17% | 2 | 0.02% | 842 | 7.25% | 11,608 |
| Niobrara | 753 | 43.15% | 975 | 55.87% | 12 | 0.69% | 3 | 0.17% | 2 | 0.11% | -222 | -12.72% | 1,745 |
| Park | 2,461 | 47.83% | 2,655 | 51.60% | 20 | 0.39% | 6 | 0.12% | 3 | 0.06% | -194 | -3.77% | 5,145 |
| Platte | 1,465 | 51.35% | 1,366 | 47.88% | 7 | 0.25% | 13 | 0.46% | 2 | 0.07% | 99 | 3.47% | 2,853 |
| Sheridan | 3,852 | 50.68% | 3,698 | 48.65% | 38 | 0.50% | 12 | 0.16% | 1 | 0.01% | 154 | 2.03% | 7,601 |
| Sublette | 496 | 44.05% | 622 | 55.24% | 6 | 0.53% | 1 | 0.09% | 1 | 0.09% | -126 | -11.19% | 1,126 |
| Sweetwater | 5,146 | 63.65% | 2,538 | 31.39% | 363 | 4.49% | 18 | 0.22% | 20 | 0.25% | 2,608 | 32.26% | 8,085 |
| Teton | 556 | 43.13% | 719 | 55.78% | 9 | 0.70% | 2 | 0.16% | 3 | 0.23% | -163 | -12.65% | 1,289 |
| Uinta | 1,632 | 56.31% | 1,239 | 42.75% | 19 | 0.66% | 7 | 0.24% | 1 | 0.03% | 393 | 13.56% | 2,898 |
| Washakie | 851 | 44.21% | 1,074 | 55.79% | 0 | 0.00% | 0 | 0.00% | 0 | 0.00% | -223 | -11.58% | 1,925 |
| Weston | 822 | 45.97% | 962 | 53.80% | 3 | 0.17% | 1 | 0.06% | 0 | 0.00% | -140 | -7.83% | 1,788 |
| Totals | 52,354 | 51.62% | 47,947 | 47.27% | 931 | 0.92% | 137 | 0.14% | 56 | 0.06% | 4,407 | 4.35% | 101,425 |

|
Democratic
Hold
Gain from Republican
Republican
Hold
|
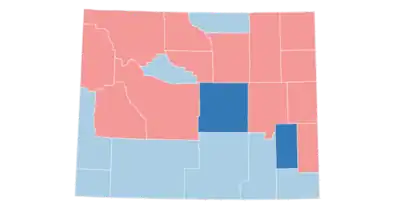
Counties that flipped from Republican to Democratic
See also
References
- 1 2 "1948 Presidential Election Results Wyoming".
- ↑ "How the red and blue map evolved over the past century". June 29, 2016.
- 1 2 Géoelections; 1948 Presidential Election Popular Vote (.xlsx file for €15)
- ↑ Géoelections; Popular Vote for Henry Wallace (.xlsx file for €15)
- 1 2 Our Campaigns; WY US Presidential Race, November 02, 1948
.jpg.webp)
.jpg.webp)
