| |||||||||||||||||||||||||||||||
40 seats in the Parliament of Malta 21 seats needed for a majority | |||||||||||||||||||||||||||||||
This lists parties that won seats. See the complete results below.
| |||||||||||||||||||||||||||||||
 |
|---|
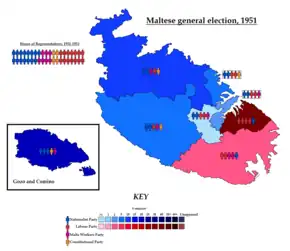
Early general elections were held in Malta between 5 and 7 May 1951.[1] They came less than a year after the previous elections as a result of disagreements in the coalition government formed by the centre-right Nationalist Party and centre-left Malta Workers Party. Although the Malta Labour Party received the most votes, the Nationalist Party remained the largest party, winning 15 of the 40 seats. Despite their previous disagreements, the Nationalist Party and Workers Party formed a new government.
Electoral system
The elections were held using the single transferable vote system.[2]
Results
| Party | Votes | % | Seats | +/– | |
|---|---|---|---|---|---|
| Malta Labour Party | 40,208 | 35.70 | 14 | +3 | |
| Nationalist Party | 39,946 | 35.47 | 15 | +3 | |
| Malta Workers Party | 21,158 | 18.79 | 7 | –4 | |
| Constitutional Party | 9,150 | 8.12 | 4 | 0 | |
| Jones Party | 957 | 0.85 | 0 | 0 | |
| Independents | 1,206 | 1.07 | 0 | –1 | |
| Total | 112,625 | 100.00 | 40 | 0 | |
| Valid votes | 112,625 | 99.35 | |||
| Invalid/blank votes | 741 | 0.65 | |||
| Total votes | 113,366 | 100.00 | |||
| Registered voters/turnout | 151,979 | 74.59 | |||
| Source: Nohlen & Stöver | |||||
References
- ↑ Dieter Nohlen & Philip Stöver (2010) Elections in Europe: A data handbook, p1302 ISBN 978-3-8329-5609-7
- ↑ Nohlen & Stöver, p1298
This article is issued from Wikipedia. The text is licensed under Creative Commons - Attribution - Sharealike. Additional terms may apply for the media files.

