| ||||||||||||||||||||||||||||||||||||||
All 50 seats to the Regional Council of Tuscany | ||||||||||||||||||||||||||||||||||||||
This lists parties that won seats. See the complete results below.
| ||||||||||||||||||||||||||||||||||||||
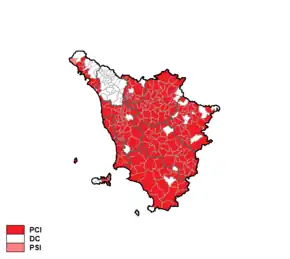
Tuscan regional election of 1985 took place on 12 May 1985.
Electoral law
Election was held under proportional representation with provincial constituencies where the largest remainder method with a Droop quota was used. To ensure more proportionality, remained votes and seats were transferred at regional level and calculated at-large.
Results
The Italian Communist Party was by far the largest party. After the election Gianfranco Bartolini, the incumbent Communist President of the Region, formed a new government with the support of the Italian Socialist Party and the Italian Democratic Socialist Party.[1]
 | ||||
| Parties | votes | votes (%) | seats | |
|---|---|---|---|---|
| Italian Communist Party | 1,183,428 | 46.2 | 25 | |
| Christian Democracy | 679,986 | 26.6 | 14 | |
| Italian Socialist Party | 306,797 | 12.0 | 5 | |
| Italian Social Movement | 118,420 | 4.6 | 2 | |
| Italian Republican Party | 84,725 | 3.3 | 1 | |
| Italian Democratic Socialist Party | 43,810 | 1.7 | 1 | |
| Green List | 41,281 | 1.6 | 1 | |
| Proletarian Democracy | 37,098 | 1.5 | 1 | |
| Italian Liberal Party | 28,863 | 1.1 | - | |
| Pensioners Italian Alliance – Venetian League | 11,798 | 0.5 | - | |
| Hunting – Fishing – Environment | 10,797 | 0.4 | - | |
| Pensioners' National Party | 8,234 | 0.3 | - | |
| Valdostan Union – Democratic Party – others | 4,208 | 0.2 | - | |
| Humanist Party | 1,027 | 0.0 | - | |
| Total | 2,560,472 | 100.0 | 50 | |
Source: Ministry of the Interior
References
- ↑ "Consiglio regionale della Toscana". Archived from the original on 2008-06-19. Retrieved 2008-12-15.
This article is issued from Wikipedia. The text is licensed under Creative Commons - Attribution - Sharealike. Additional terms may apply for the media files.
