| This article is part of a series on the |
| Politics of India |
|---|
 |
|
|
Elections in the Republic of India in 1985 included elections to fourteen state legislative assemblies.
Legislative Assembly elections
Andhra Pradesh
| No | Party | Seats Contested | Seats Won | Seats change | Vote Share | Swing |
|---|---|---|---|---|---|---|
| 1 | Telugu Desam Party | 250 | 202 | +1 | 46.21% | -7.50% |
| 2 | Indian National Congress | 290 | 50 | -10 | 37.25% | +3.67% |
| 3 | Communist Party of India (Marxist) | 12 | 11 | +6 | 2.31% | +0.20% |
| 4 | Communist Party of India | 12 | 11 | +7 | 2.69% | -0.10% |
| 5 | Bharatiya Janata Party | 10 | 8 | +3 | 1.32% | -1.14% |
| 6 | Janata Party | 5 | 3 | +2 | 0.76% | -0.20% |
Assam
| Pos | Party | Contested | Seats | Swing | |
|---|---|---|---|---|---|
| 1 | Independent | 104 | 92 | ||
| 2 | Indian National Congress | 125 | 25 | ||
| 3 | Indian Congress (Socialist) | 72 | 4 | ||
| 4 | Plain Tribals Council of Assam | 28 | 3 | - | |
| 5 | Communist Party of India (Marxist) | 39 | 2 | - | |
| Total | 126 | ||||
Bihar
| Party | Party Flag | Seats Contested | Seats Won | Popular Vote | Percentage |
|---|---|---|---|---|---|
| Indian National Congress | 323 | 196 | 9,558,562 | 39.30% | |
| Lok Dal | 261 | 46 | 3,573,173 | 14.69% | |
| Bharatiya Janata Party | 234 | 16 | 1,833,275 | 7.54% | |
| Janata Party | 229 | 13 | 1,754,705 | 7.21% | |
| Communist Party of India | 167 | 12 | 2,154,066 | 8.86% | |
| Jharkhand Mukti Morcha | 57 | 9 | 443,822 | 1.82% | |
| Communist Party of India (Marxist) | 44 | 1 | 392,375 | 1.61% | |
| Indian Congress (Socialist) | 59 | 1 | 160,159 | 0.66% | |
| Socialist Unity Centre of India | 1 | 1 | 17,890 | 0.07% | |
| Independents | 2804 | 29 | 4,349,057 | 17.88% | |
| Total | 4237 | 324 | 24,323,868 |
Source:[1]
Gujarat
| Parties and coalitions | Popular vote | Seats | ||
|---|---|---|---|---|
| Votes | % | Won | +/− | |
| Indian National Congress (INC) | 5,122,753 | 55.55 | 149 | +8 |
| Janata Party | 1,775,338 | 19.25 | 14 | -7 |
| Bharatiya Janata Party (BJP) | 1,379,120 | 14.96 | 11 | +2 |
| Independents (IND) | 856,160 | 9.28 | 8 | |
| CPM | 16,543 | 0.18 | 0 | 0 |
| CPI | 24,013 | 0.26 | 0 | 0 |
| Total | 9,221,149 | 100.00 | 182 | ±0 |
| Valid votes | 7,770,198 | 98.03 | ||
| Invalid votes | 155,782 | 1.97 | ||
| Votes cast / turnout | 13,676,131 | 51.59 | ||
| Registered voters | 15,363,762 | |||
Himachal Pradesh
| Rank | Party | Seats Contested | Seats won | % votes |
|---|---|---|---|---|
| 1 | Indian National Congress | 68 | 58 | 55.86 |
| 2 | Bharatiya Janata Party | 57 | 7 | 35.87 |
| 3 | Independent | 68 | 2 | 8.28 |
| 4 | Lok Dal | 3 | 1 | 1.44 |
| Total | 68 |
Source:[2]
Karnataka
| Political Party |
Seats Contested |
Seats Won |
Number of Votes |
% of Votes |
Seat change | |
|---|---|---|---|---|---|---|
| Janata Party | 205 | 139 | 6,418,795 | 43.60% | ||
| Indian National Congress | 223 | 65 | 6,009,461 | 40.82% | ||
| Communist Party of India | 7 | 3 | 133,008 | 0.90% | ||
| Bharatiya Janata Party | 116 | 2 | 571,280 | 3.88% | ||
| Communist Party of India (Marxist) | 7 | 2 | 127,333 | 0.86% | ||
| Independents | 1200 | 13 | 1,393,626 | 9.47% | ||
| Total | 1795 | 224 | 14,720,634 |
Madhya Pradesh
Source:[4]
| SN | Party | Seats Contested |
Seats won |
Seats Changed |
% Votes |
|---|---|---|---|---|---|
| 1 | Indian National Congress | 320 | 250 | +4 | 48.87 |
| 1 | Bharatiya Janata Party | 311 | 58 | -2 | 32.42% |
| 3 | Janata Party | 172 | 5 | +3 | 4.01% |
| 4 | Indian National Congress (S) | 30 | 1 | N/A | 0.40% |
| 7 | Independent | 320 | 6 | -2 | 10.82% |
| Total | 320 |
Maharashtra
| Political Party |
No. of candidates |
No. of elected |
Number of Votes |
% of Votes |
Seat change | |
|---|---|---|---|---|---|---|
| Indian National Congress | 287 | 161 | 9,522,556 | 43.41% | ||
| Indian National Congress (Socialist) | 126 | 54 | 3,790,850 | 17.28% | ||
| Janata Party | 61 | 20 | 1,618,101 | 7.38% | ||
| Bharatiya Janata Party | 67 | 16 | 1,590,351 | 7.25% | ||
| Peasants and Workers Party of India | 29 | 13 | 825,949 | 3.77% | ||
| Communist Party of India | 31 | 2 | 202,790 | 0.92% | ||
| Communist Party of India (Marxist) | 14 | 2 | 174,350 | 0.79% | ||
| Independents | 1506 | 20 | 3,836,390 | 17.49% | ||
| Total | 2230 | 288 | 21,934,742 |
Odisha
| Political Party | Flag | Seats Contested | Won | Net Change in seats | % of Seats |
Votes | Vote % | Change in vote % | |
|---|---|---|---|---|---|---|---|---|---|
| Indian National Congress | 147 | 117 | 79.59 | 40,07,258 | 51.08 | ||||
| Communist Party of India (Marxist) | 27 | 1 | - | 0.68 | 89,225 | 15.97 | - | ||
| Bharatiya Janata Party | 67 | 1 | 0.68 | 2,04,346 | 5.66 | ||||
| Communist Party of India | 27 | 1 | 0.68 | 2,59,508 | 16.12 | ||||
| Janata Party | 140 | 21 | - | 14.28 | 24,01,566 | 32.03 | |||
| Independent | 374 | 7 | N/A | 4.76 | 8,23,850 | 11.54 | N/A | ||
| Total Seats | 147 ( | Voters | 1,53,37,200 | Turnout | 80,16,583 (52.27%) | ||||
Punjab
| Result of Punjab Legislative Assembly election 1985 [7] | ||||||
|---|---|---|---|---|---|---|
| Party | contested | Seats won | change in seats | popular vote | % | |
| Shiromani Akali Dal | 100 | 73 | 26,30,270 | 38.01 | ||
| Indian National Congress | 117 | 32 | 26,20,042 | 37.86 | ||
| Bharatiya Janata Party | 26 | 6 | 3,45,560 | 4.99 | ||
| Communist Party of India | 38 | 1 | 3,07,496 | 4.44 | ||
| Janata Party | 5 | 1 | 75,307 | 1.09 | ||
| Independents | 542 | 4 | 8,09,254 | 11.69 | ||
| Others | 29 | 0 | - | 1,32,889 | 1.92 | |
| Total | 857 | 117 | 69,20,818 | |||
Puducherry
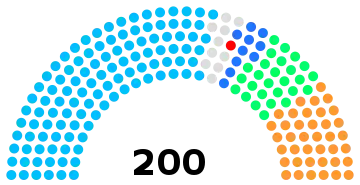
Rajasthan
 | |||||
|---|---|---|---|---|---|
| Party | Votes | % | Seats | +/– | |
| Indian National Congress | 5,342,920 | 46.57 | 113 | –20 | |
| Bharatiya Janata Party | 2,437,594 | 21.24 | 39 | +7 | |
| Lok Dal | 1,360,826 | 11.86 | 27 | New | |
| Janata Party | 675,103 | 5.88 | 10 | +2 | |
| Communist Party of India | 141,063 | 1.23 | 1 | 0 | |
| Indian National Congress (Jagjivan) | 74,176 | 0.65 | 0 | New | |
| Communist Party of India (Marxist) | 66,921 | 0.58 | 0 | –1 | |
| Indian Congress (Socialist) | 9,731 | 0.08 | 0 | New | |
| Independents | 1,365,641 | 11.90 | 10 | –2 | |
| Total | 11,473,975 | 100.00 | 200 | 0 | |
| Valid votes | 11,473,975 | 98.40 | |||
| Invalid/blank votes | 186,527 | 1.60 | |||
| Total votes | 11,660,502 | 100.00 | |||
| Registered voters/turnout | 21,228,702 | 54.93 | |||
| Source: ECI[8] | |||||
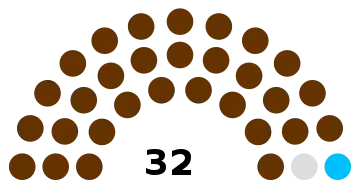
Sikkim
 | |||||
|---|---|---|---|---|---|
| Party | Votes | % | Seats | +/– | |
| Sikkim Sangram Parishad | 60,371 | 62.20 | 30 | +14 | |
| Indian National Congress | 23,440 | 24.15 | 1 | +1 | |
| Janata Party | 913 | 0.94 | 0 | 0 | |
| Sikkim Prajatantra Congress | 438 | 0.45 | 0 | –4 | |
| Communist Party of India (Marxist) | 336 | 0.35 | 0 | 0 | |
| Communist Party of India | 25 | 0.03 | 0 | New | |
| Independents | 11,534 | 11.88 | 1 | 0 | |
| Total | 97,057 | 100.00 | 32 | 0 | |
| Valid votes | 97,057 | 97.61 | |||
| Invalid/blank votes | 2,378 | 2.39 | |||
| Total votes | 99,435 | 100.00 | |||
| Registered voters/turnout | 155,041 | 64.13 | |||
| Source: ECI[9] | |||||
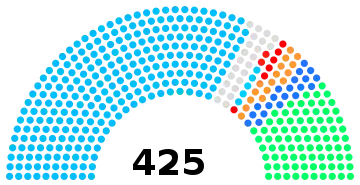
Uttar Pradesh
 | |||||
|---|---|---|---|---|---|
| Party | Votes | % | Seats | +/– | |
| Indian National Congress | 11,544,698 | 39.25 | 269 | –40 | |
| Lok Dal | 6,304,455 | 21.43 | 84 | New | |
| Bharatiya Janata Party | 2,890,884 | 9.83 | 16 | +5 | |
| Janata Party | 1,646,005 | 5.60 | 20 | +16 | |
| Communist Party of India | 894,620 | 3.04 | 6 | 0 | |
| Indian National Congress (Jagjivan) | 669,031 | 2.27 | 5 | New | |
| Doordarshi Party | 228,688 | 0.78 | 0 | New | |
| Communist Party of India (Marxist) | 198,780 | 0.68 | 2 | 0 | |
| Indian Congress (Socialist) | 88,616 | 0.30 | 0 | New | |
| All India Forward Bloc | 4,074 | 0.01 | 0 | New | |
| Revolutionary Socialist Party | 1,297 | 0.00 | 0 | New | |
| Republican Party of India | 562 | 0.00 | 0 | 0 | |
| Independents | 4,942,962 | 16.80 | 23 | +6 | |
| Total | 29,414,672 | 100.00 | 425 | 0 | |
| Valid votes | 29,414,672 | 98.53 | |||
| Invalid/blank votes | 437,456 | 1.47 | |||
| Total votes | 29,852,128 | 100.00 | |||
| Registered voters/turnout | 65,404,531 | 45.64 | |||
| Source: ECI[10] | |||||
References
- ↑ Election Commission of India. STATISTICAL REPORT ON GENERAL ELECTION, 1985 TO THE LEGISLATIVE ASSEMBLY OF BIHAR
- ↑ "STATISTICAL REPORT ON GENERAL ELECTION, 1985 TO THE LEGISLATIVE ASSEMBLY OF HIMACHAL PRADESH" (PDF).
- ↑ "Statistical Report on General Election, 1985 to the Legislative Assembly of Karnataka, Election Commission of India" (PDF). Election Commission of India.
- ↑ "STATISTICAL REPORT ON GENERAL ELECTION, 1985 TO THE LEGISLATIVE ASSEMBLY OF MADHYA PRADESH". eci.nic.in. Election Commission of India. Retrieved 27 May 2018.
- ↑ "Key Highlights of General Election, 1985 to the Legislative Assembly of Maharashtra" (PDF). Election Commission of India.
- ↑ "Orissa 1985". Election Commission of India. Retrieved 17 June 2021.
- ↑ "List of Polling Booth for Punjab Lok Sabha Elections 1985".
- ↑ "Statistical Report on General Election, 1985 to the Legislative Assembly of Rajasthan". Election Commission of India. Retrieved 28 December 2021.
- ↑ "Statistical Report on General Election, 1985 to the Legislative Assembly of Sikkim". Election Commission of India.
- ↑ "Statistical Report on General Election, 1985 to the Legislative Assembly of Uttar Pradesh". Election Commission of India. Retrieved 16 January 2022.
External links
Wikimedia Commons has media related to 1985 elections in India.
This article is issued from Wikipedia. The text is licensed under Creative Commons - Attribution - Sharealike. Additional terms may apply for the media files.


