1987 Australian Senate elections

11 July 1987

All 76 seats in the Australian Senate
39 seats needed for a majority
  First party Second party
 
Leader Fred Chaney John Button
Party Liberal/National Coalition Labor
Leader since 11 March 1983 7 November 1980
Leader's seat Western Australia Victoria
Seats before 33 34
Seats after 34 32
Seat change Increase 1 Decrease 2
Popular vote 3,939,432 4,013,860
Percentage 42.04% 42.83%
Swing Increase 2.50% Increase 0.66%

  Third party Fourth party
 
Leader Janine Haines Robert Wood
Party Democrats NDP
Leader since 18 August 1986
Leader's seat South Australia New South Wales
(won seat)
Seats before 7 1
Seats after 7 1
Seat change Steady Steady
Popular vote 794,107 102,480
Percentage 8.47% 1.09%
Swing Increase 0.85% Decrease 6.14%

Senators elected in the 1987 federal election

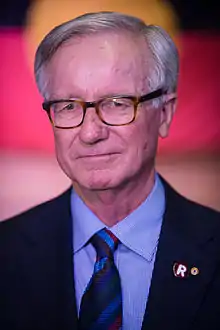
Leader of the Senate before election

John Button
Labor

Elected Leader of the Senate

John Button
Labor

The following tables show state-by-state results in the Australian Senate at the 1987 federal election. This election was a Double dissolution, which means that all 12 senators from each state were up for election. Senators total 29 coalition (27 Liberal, one coalition National, one CLP), 32 Labor, one Jo Vallentine Peace Group, four non-coalition National, seven Democrats, one Nuclear Disarmament and one Independent.[1] Territory Senators served until the next federal election. State Senator terms were nominally three or six years, backdated from 1 July 1987. The Senate used the order-elected method to allocate three- and six-year seats, despite provisions for the AEC to conduct a special recount.

Australia

Senate (STV GV) — 1987–90 – Turnout 93.84% (CV) — Informal 3.54%
Party Votes  % Swing Seats won Seats held Change
    Liberal 1,965,180 20.97 +0.38 23 27 Steady
  Liberal–National joint ticket 1,289,888 13.76 +1.05 5 N/A N/A
  National[lower-alpha 1] 664,394 7.09 +1.16 6 6 Increase 1
  Country Liberal 19,970 0.21 −0.10 1 1 Steady
Liberal/National Coalition 3,939,432 42.04 +2.50 34 34 Increase 1
  Labor 4,013,860 42.83 +0.66 32 32 Decrease 2
  Democrats 794,107 8.47 +0.85 7 7 Steady
  Nuclear Disarmament[lower-alpha 2] 102,480 1.09 −6.14 1 1 Steady
  Vallentine Peace Group[lower-alpha 2] 40,048 0.43 +0.43 1 1 Increase 1
  Harradine Group 37,037 0.40 +0.14 1 1 Steady
Total 9,371,681     76 76
Invalid/blank votes 394,891 4.0 –2.8
Turnout 9,766,571 90.5
Registered voters 10,353,213
Source: Federal Election Results 1949-1993
  • As this was a double-dissolution election, all Senate seats were contested.

New South Wales

1987 Australian federal election: Senate, New South Wales
Party Candidate Votes % ±%
Quota 245,883
Labor 1. Kerry Sibraa (elected 1)
2. Arthur Gietzelt (elected 4)
3. Graham Richardson (elected 6)
4. Bruce Childs (elected 8)
5. John Morris (elected 10)
6. Sue West
7. Michael Sexton
1,355,792 42.4 +0.8
Coalition 1. Michael Baume (Lib) (elected 2)
2. Peter Baume (Lib) (elected 5)
3. David Brownhill (Nat) (elected 7)
4. Chris Puplick (Lib) (elected 9)
5. Bronwyn Bishop (Lib) (elected 11)
6. Ralph Schulze (Nat)
7. June McPhie (Lib)
1,289,888 40.4 +3.4
Democrats 1. Paul McLean (elected 3)
2. Jenny Macleod
3. Richard Jones
4. Gary Chestnut
290,049 9.1 -0.6
Call to Australia 1. Elaine Nile
2. Kevin Hume
107,859 3.4 -0.2
Nuclear Disarmament 1. Robert Wood (elected 12)
2. Irina Dunn
48,998 1.5 -8.2
Greens 1. Ian Cohen
2. Daphne Gollan
32,513 1.0 +1.0
Group A 1. Ruth Phillips
2. Walter Brun
30,504 0.9 +0.9
Defence and Ex-Services 1. Leslie Edwards
2. David Herd
3. William Tuohy
4. Rowley McMahon
14,431 0.4 +0.4
Unite Australia 1. Alan Smith
2. Edna Fabb
5,458 0.2 +0.2
Group I 1. Peter Consandine
2. Brian Buckley
4,519 0.1 +0.1
Group F 1. Leon Bringolf
2. Habib Fares
3. Jim Donovan
4,238 0.1 +0.1
Group M 1. John Higginbotham
2. Ian Murphy
3,795 0.1 +0.1
Group B 1. Patricia Poulos
2. John Holley
3. John Beasley
3,749 0.1 +0.1
Independent Arthur Chesterfield-Evans 1,706 0.1 +0.1
Independent Bob Spanswick 968 0.0 0.0
Independent Ivor F 765 0.0 0.0
Independent Phil Murray 564 0.0 0.0
Independent Nick Jones 270 0.0 0.0
Independent Jame Smith-New 234 0.0 0.0
Independent Keith Larkings 88 0.0 0.0
Independent James Goody 86 0.0 0.0
Total formal votes 3,196,474 95.1 +0.7
Informal votes 164,001 4.9 -0.7
Turnout 3,360,475 94.5 +0.1
# Senator Party
1 Kerry Sibraa   Labor
2 Michael Baume   Liberal
3 Paul McLean   Democrat
4 Arthur Gietzelt   Labor
5 Peter Baume   Liberal
6 Graham Richardson   Labor
7 David Brownhill   National
8 Bruce Childs   Labor
9 Chris Puplick   Liberal
10 John Morris   Labor
11 Bronwyn Bishop   Liberal
12 Robert Wood   NDP

Victoria

1987 Australian federal election: Senate, Victoria
Party Candidate Votes % ±%
Quota 189,970
Labor 1. John Button (elected 1)
2. Gareth Evans (elected 4)
3. Olive Zakharov (elected 6)
4. Robert Ray (elected 8)
5. Barney Cooney (elected 10)
6. John Halfpenny
7. Carole Taylor
1,086,513 44.0 -0.1
Liberal 1. Austin Lewis (elected 2)
2. Jim Short (elected 5)
3. Richard Alston (elected 7)
4. David Hamer (elected 9)
5. Kay Patterson (elected 12)
6. John Wyld
7. John Goodfellow
8. John Riggall
9. Severn Clarke
878,899 35.6 +1.4
Democrats 1. Janet Powell (elected 3)
2. Sid Spindler
3. Ken Peak
4. Harold Fraser
5. Peter Allen
211,043 8.5 +1.6
National 1. Julian McGauran (elected 11)
2. Noel Maughan
3. Les Flintoff
140,143 5.7 +1.7
Democratic Labor 1. John Mulholland
2. Gloria Brook
50,894 2.0 +0.6
Call to Australia 1. Al Watson
2. Loretto Brennan
3. John Easton
28,966 1.2 -0.1
Nuclear Disarmament 1. Aldo Penbrook
2. Nik Dow
28,352 1.1 -6.2
Pensioner 1. Neil McKay
2. Rosamond Ewan
17,265 0.7 -0.1
Unite Australia 1. John Siddons
2. Ian Price
3. Lisa Harris
11,213 0.5 +0.5
Group B 1. Bill Hartley
2. Laurene Dietrich
3. David Kerin
4. Rola Haidar
4,243 0.2 +0.2
Group L 1. Laurie Dunlop
2. Simon Hood
4,113 0.2 +0.2
Group F 1. David Caccianiga
2. Bill Thiele
2,145 0.1 +0.1
Group O 1. Dino de Marchi
2. Ineke Black
2,086 0.1 +0.1
Group J 1. Lisa King
2. Kevin O'Connell
1,729 0.1 +0.1
Group K 1. Alan Miller
2. Maria Bennett
1,320 0.1 +0.1
Independent Kym Roylance 510 0.0 0.0
Independent Abraham Abdalla 172 0.0 0.0
Total formal votes 2,469,606 96.0 +0.2
Informal votes 102,382 4.0 -0.2
Turnout 2,571,988 95.3 -0.1
# Senator Party
1 John Button   Labor
2 Austin Lewis   Liberal
3 Janet Powell   Democrat
4 Gareth Evans   Labor
5 Jim Short   Liberal
6 Olive Zakharov   Labor
7 Richard Alston   Liberal
8 Robert Ray   Labor
9 David Hamer   Liberal
10 Barney Cooney   Labor
11 Julian McGauran   National
12 Kay Patterson   Liberal

Queensland

1987 Australian federal election: Senate, Queensland
Party Candidate Votes % ±%
Quota 117,721
Labor 1. Margaret Reynolds (elected 1)
2. Mal Colston (elected 4)
3. Gerry Jones (elected 7)
4. John Black (elected 9)
5. Bryant Burns (elected 10)
6. Jack Camp
7. Glenevie Jensen
643,094 42.0 +2.3
National 1. Flo Bjelke-Petersen (elected 2)
2. John Stone (elected 5)
3. Ron Boswell (elected 8)
4. Glen Sheil (elected 12)
5. George Cowan
6. Vicky Kippin
7. Ann Garms
8. Bruce Laming
439,618 28.7 -0.2
Liberal 1. David MacGibbon (elected 3)
2. Warwick Parer (elected 6)
3. Gary Neat
4. Cassie Solomon
5. Brian Taylor
6. Jane Williamson
275,085 18.0 +0.6
Democrats 1. Michael Macklin (elected 11)
2. Cheryl Kernot
3. Norman Johnson
4. Anthony Walters
115,456 7.5 -1.7
Independent George Georges 26,795 1.8 +1.8
Nuclear Disarmament 1. John Jones
2. Brian Dunsford
17,411 1.1 -3.3
Group A 1. Barry Weedon
2. Kathleen Wacker
6,692 0.4 +0.4
Independent Ron Smith 3,410 0.2 +0.2
Unite Australia 1. Ron Alford
2. Geoff Fawthrop
1,638 0.1 +0.1
Group C 1. Ray Ferguson
2. Jake Haub
737 0.0 0.0
Independent John Bolt 424 0.0 0.0
Total formal votes 1,530,360 96.9 -0.1
Informal votes 49,609 3.1 +0.1
Turnout 1,579,969 92.5 -0.9
# Senator Party
1 Margaret Reynolds   Labor
2 Flo Bjelke-Petersen   National
3 David MacGibbon   Liberal
4 Mal Colston   Labor
5 John Stone   National
6 Warwick Parer   Liberal
7 Gerry Jones   Labor
8 Ron Boswell   National
9 John Black   Labor
10 Bryant Burns   Labor
11 Michael Macklin   Democrats
12 Glen Sheil   National

Western Australia

1987 Australian federal election: Senate, Western Australia
Party Candidate Votes % ±%
Quota 63,668
Labor 1. Peter Walsh (elected 1)
2. Patricia Giles (elected 3)
3. Peter Cook (elected 5)
4. Jim McKiernan (elected 7)
5. Michael Beahan (elected 9)
6. Chris Evans
7. Ed Dermer
354,328 42.8 -0.5
Liberal 1. Fred Chaney (elected 2)
2. Peter Durack (elected 4)
3. Sue Knowles (elected 6)
4. Noel Crichton-Browne (elected 8)
5. John Panizza (elected 10)
6. Alan Eggleston
7. Cam Tinley
324,028 39.1 -1.6
Democrats 1. Jean Jenkins (elected 11)
2. Jack Evans
47,534 5.7 +1.1
National 1. James MacDonald
2. Glenice Sanders
3. Ron Aitkenhead
4. Beverley Poor
45,787 5.5 +3.7
Vallentine Peace Group 1. Jo Vallentine (elected 12)
2. Louise Duxbury
40,048 4.8 +4.8
One Australia Movement 1. Cedric Jacobs
2. Don Jackson
3. Ed Robertson
13,063 1.6 +1.6
Unite Australia 1. Allan McMullen
2. Norm Heslington
1,620 0.2 +0.2
Independent Frank Nesci 426 0.1 +0.1
Independent Mark Pallister 354 0.0 0.0
Independent Jack Flanigan 333 0.0 0.0
Independent Gordon McColl 162 0.0 0.0
Total formal votes 827,683 96.7 +1.4
Informal votes 28,284 3.3 -1.4
Turnout 855,976 94.4 +0.2
# Senator Party
1 Peter Walsh   Labor
2 Fred Chaney   Liberal
3 Patricia Giles   Labor
4 Peter Durack   Liberal
5 Peter Cook   Labor
6 Sue Knowles   Liberal
7 Jim McKiernan   Labor
8 Noel Crichton-Browne   Liberal
9 Michael Beahan   Labor
10 John Panizza   Liberal
11 Jean Jenkins   Democrats
12 Jo Vallentine   VPG

South Australia

1987 Australian federal election: Senate, South Australia
Party Candidate Votes % ±%
Quota 65,927
Labor 1. Dominic Foreman (elected 1)
2. Nick Bolkus (elected 4)
3. Graham Maguire (elected 6)
4. Rosemary Crowley (elected 8)
5. Chris Schacht (elected 10)
6. Vic Heron
7. Rosalie McDonald
354,747 41.4 -0.3
Liberal 1. Tony Messner (elected 2)
2. Amanda Vanstone (elected 5)
3. Robert Hill (elected 7)
4. Grant Chapman (elected 9)
5. Baden Teague (elected 11)
6. Michele Mercurio
7. Ivan Venning
328,039 38.3 +0.8
Democrats 1. Janine Haines (elected 3)
2. John Coulter (elected 12)
3. Meg Lees
4. Ian McLiesh
5. Peter Vervoorn
95,831 11.2 0.0
National 1. Bill Wright
2. Neville Agars
3. Mike Rogers
4. Jessie Taylor
5. Bob Brown
6. Clifford Boyd
29,954 3.5 +2.2
  Independent Liberal Don Jessop 25,876 3.0 +3.0
Greens 1. Ally Fricker
2. Jules Davison
8,102 0.9 +0.9
Group A 1. Creston Magasdi
2. Reg McColl
5,715 0.7 +0.7
Unite Australia 1. David Vigor
2. Nick Theologou
3. Patricia Prowse
4. Maxwell Elphick
4,775 0.6 +0.6
Communist 1. John Wishart
2. Linda Gale
2,456 0.3 +0.3
Group F 1. Tom Towle
2. Ellen Towle
788 0.1 +0.1
Independent Bill Forster 276 0.0 0.0
Independent Rob Robertson 199 0.0 0.0
Independent Robert Worth 145 0.0 0.0
Independent John Out 47 0.0 0.0
Independent Helen Launer 44 0.0 0.0
Independent Syd Plenty 29 0.0 0.0
Independent Stephen Bailey 19 0.0 0.0
Total formal votes 857,042 96.2 +1.6
Informal votes 33,514 3.8 -1.6
Turnout 890,556 94.5 -0.7
# Senator Party
1 Dominic Foreman   Labor
2 Tony Messner   Liberal
3 Janine Haines   Democrats
4 Nick Bolkus   Labor
5 Amanda Vanstone   Liberal
6 Graham Maguire   Labor
7 Robert Hill   Liberal
8 Rosemary Crowley   Labor
9 Grant Chapman   Liberal
10 Chris Schacht   Labor
11 Baden Teague   Liberal
12 John Coulter   Democrats

Tasmania

1987 Australian federal election: Senate, Tasmania
Party Candidate Votes % ±%
Quota 21,451
Labor 1. Michael Tate (elected 1)
2. John Coates (elected 4)
3. Terry Aulich (elected 6)
4. Ray Devlin (elected 8)
5. John Devereux (elected 10)
6. Janet Cooper
7. John Green
113,638 40.8 -0.8
Liberal 1. Brian Archer (elected 2)
2. Shirley Walters (elected 5)
3. John Watson (elected 7)
4. Jocelyn Newman (elected 9)
5. Paul Calvert (elected 11)
6. Vince Smith
7. Peter Aldridge
108,039 38.7 -2.0
Harradine Group 1. Brian Harradine (elected 3)
2. Colin Sacco
37,037 13.3 +4.5
Democrats 1. Norm Sanders (elected 12)
2. Nick Goldie
3. Isla Macgregor
18,841 6.8 +0.7
Independent Michael Mansell 1,102 0.4 +0.4
Independent Laurie Heathorn 203 0.1 +0.1
Total formal votes 278,860 96.2 +2.0
Informal votes 11,119 3.8 -2.0
Turnout 289,979 96.4 +0.6
# Senator Party
1 Michael Tate   Labor
2 Brian Archer   Liberal
3 Brian Harradine   Independent
4 John Coates   Labor
5 Shirley Walters   Liberal
6 Terry Aulich   Labor
7 John Watson   Liberal
8 Ray Devlin   Labor
9 Jocelyn Newman   Liberal
10 John Devereux   Labor
11 Paul Calvert   Liberal
12 Norm Sanders   Democrats

Australian Capital Territory

1987 Australian federal election: Senate, Australian Capital Territory
Party Candidate Votes % ±%
Quota 50,047
Labor 1. Susan Ryan (elected 1)
2. Barry Reid
74,876 49.9 +5.5
Liberal 1. Margaret Reid (elected 2)
2. Bill Stefaniak
51,090 34.0 +2.1
Democrats 1. Andrew Freeman
2. Geoff Quayle
15,353 10.2 +1.0
Nuclear Disarmament 1. Michael Denborough
2. Margaret Matthews
7,719 5.1 -5.2
Independent Leonard Munday 433 0.3 +0.3
Independent David Ash 433 0.3 +0.3
Independent John Murray 234 0.2 +0.2
Total formal votes 150,138 97.7 +1.1
Informal votes 3,672 2.3 -1.1
Turnout 153,810 94.5 +0.6
# Senator Party
1 Susan Ryan   Labor
2 Margaret Reid   Liberal

Northern Territory

1987 Australian federal election: Senate, Northern Territory
Party Candidate Votes % ±%
Quota 20,506
Labor 1. Bob Collins (elected 1)
2. Lyn Reid
30,872 50.2 +4.5
Country Liberal 1. Grant Tambling (elected 2)
2. Ian Towns
19,970 32.5 -16.6
NT Nationals 1. Jim Petrich
2. Joan Small
8,892 14.5 +14.5
Group C 1. Lyn Allen
2. Catherin Paul
1,632 2.7 +2.7
Independent Yuri Juriev 151 0.2 +0.2
Total formal votes 61,517 96.3 -0.5
Informal votes 2,374 3.7 +0.5
Turnout 63,891 79.9 -5.6
# Senator Party
1 Bob Collins   Labor
2 Grant Tambling   CLP

See also

Notes

  1. The National includes the NT Nationals, consistent with the Parliamentary Library results,[1] however the totals in Psephos: Adam Carr's Electoral Archive do not include the NT Nationals.[2]
  2. 1 2 Jo Vallentine had been elected in 1984 as a Nuclear Disarmament Party member, but resigned in 1985, serving out the remainder of her term as an independent.
  3. There was no national greens party in 1987. The greens total includes Greens New South Wales (32,513) and Greens South Australia (8,102).

References

  1. 1 2 "Federal Election Results 1949-1993" (PDF). Parliament of Australia. Retrieved 12 July 2017.
  2. "1987 Senate". Psephos Adam Carr's Election Archive. Retrieved 26 June 2022.
This article is issued from Wikipedia. The text is licensed under Creative Commons - Attribution - Sharealike. Additional terms may apply for the media files.