| ||||||||||||||||||||||||||||||||||||||||
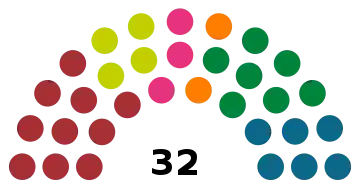
This lists parties that won seats. See the complete results below.
| ||||||||||||||||||||||||||||||||||||||||
 |
|---|
Parliamentary elections were held in the Faroe Islands on 17 November 1990.
Results
 | |||||
|---|---|---|---|---|---|
| Party | Votes | % | Seats | +/– | |
| Social Democratic Party | 7,805 | 27.46 | 10 | +3 | |
| People's Party | 6,234 | 21.94 | 7 | –1 | |
| Union Party | 5,367 | 18.88 | 6 | –1 | |
| Republican Party | 4,178 | 14.70 | 4 | –2 | |
| Self-Government Party | 2,489 | 8.76 | 3 | +1 | |
| Christian People's Party | 1,681 | 5.91 | 2 | 0 | |
| Social Separatist Party | 666 | 2.34 | 0 | New | |
| Total | 28,420 | 100.00 | 32 | 0 | |
| Valid votes | 28,420 | 98.27 | |||
| Invalid/blank votes | 501 | 1.73 | |||
| Total votes | 28,921 | 100.00 | |||
| Registered voters/turnout | 33,044 | 87.52 | |||
| Source: Árbók fyri Føroyar 2003 | |||||
This article is issued from Wikipedia. The text is licensed under Creative Commons - Attribution - Sharealike. Additional terms may apply for the media files.