| ||||||||||||||||||||||||||||||||||||||||||||||||||||||||
All 101 seats of the Landtag of Rhineland-Palatinate 51 seats needed for a majority | ||||||||||||||||||||||||||||||||||||||||||||||||||||||||
|---|---|---|---|---|---|---|---|---|---|---|---|---|---|---|---|---|---|---|---|---|---|---|---|---|---|---|---|---|---|---|---|---|---|---|---|---|---|---|---|---|---|---|---|---|---|---|---|---|---|---|---|---|---|---|---|---|
| Turnout | 2,125,407 (73.9%) | |||||||||||||||||||||||||||||||||||||||||||||||||||||||
| ||||||||||||||||||||||||||||||||||||||||||||||||||||||||
 Results for the single-member constituencies | ||||||||||||||||||||||||||||||||||||||||||||||||||||||||
| ||||||||||||||||||||||||||||||||||||||||||||||||||||||||
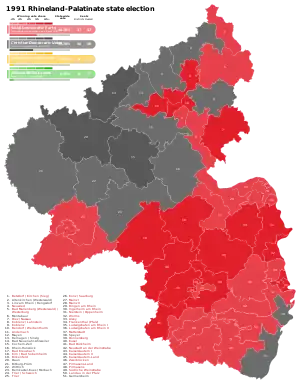
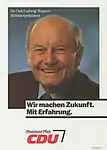
The 1991 Rhineland-Palatinate state election was held on 21 April 1991 to elect the members of the Landtag of Rhineland-Palatinate. The incumbent coalition government of the Christian Democratic Union (CDU) and Free Democratic Party (FDP) led by Minister-President Carl-Ludwig Wagner was defeated, losing its majority. The Social Democratic Party (SPD) moved into first place, forming a coalition with the FDP. SPD leader Rudolf Scharping was subsequently elected as Minister-President.
This election marked several changes in the state history:
First, a change in the state election system. Previous elections were held purely proportionally, however, from that election on, the elections were held more in line with the federal mixed-member proportional representation, with both direct constituencies and proportional representation.
Secondly, from 1991 on, the Landtag became elected for five years instead of the previous four.
Thirdly, the election marked a shift in the state's political alignment: for 44 years (1947-1991) the state had been governed by CDU, with CDU coming first in every election As of 2023, the state has been continuously governed by SPD since the election.
Parties
The table below lists parties represented in the previous Landtag of Rhineland-Palatinate.
| Name | Ideology | Leader(s) | 1987 result | |||
|---|---|---|---|---|---|---|
| Votes (%) | Seats | |||||
| CDU | Christian Democratic Union of Germany Christlich Demokratische Union Deutschlands |
Christian democracy | Carl-Ludwig Wagner | 45.1% | 48 / 101 | |
| SPD | Social Democratic Party of Germany Sozialdemokratische Partei Deutschlands |
Social democracy | Rudolf Scharping | 38.8% | 40 / 101 | |
| FDP | Free Democratic Party Freie Demokratische Partei |
Classical liberalism | 7.3% | 7 / 101 | ||
| Grüne | Alliance 90/The Greens Bündnis 90/Die Grünen |
Green politics | 5.9% | 5 / 101 | ||
Election result
 | |||||||
| Party | Votes | % | +/- | Seats | +/- | Seats % | |
|---|---|---|---|---|---|---|---|
| Social Democratic Party (SPD) | 951,695 | 44.8 | 47 | 46.5 | |||
| Christian Democratic Union (CDU) | 822,449 | 38.7 | 40 | 39.6 | |||
| Free Democratic Party (FDP) | 146,400 | 6.9 | 7 | 6.9 | |||
| Alliance 90/The Greens (Grüne) | 137,139 | 6.5 | 7 | 6.9 | |||
| The Republicans (REP) | 43,380 | 2.0 | 0 | ±0 | 0 | ||
| Others | 24,244 | 1.1 | 0 | ±0 | 0 | ||
| Total | 2,125,407 | 100.0 | 101 | ||||
| Voter turnout | 73.9 | ||||||

