| |||||||||||||||||||||||||||||||||||||||||
15 seats in the House of Assembly 8 seats needed for a majority | |||||||||||||||||||||||||||||||||||||||||
|---|---|---|---|---|---|---|---|---|---|---|---|---|---|---|---|---|---|---|---|---|---|---|---|---|---|---|---|---|---|---|---|---|---|---|---|---|---|---|---|---|---|
| Turnout | 65.6% ( | ||||||||||||||||||||||||||||||||||||||||
| |||||||||||||||||||||||||||||||||||||||||
 | |||||||||||||||||||||||||||||||||||||||||


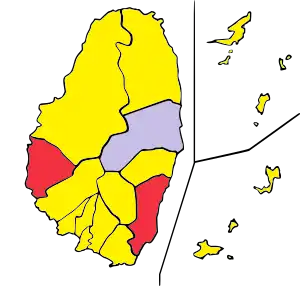
General elections were held in Saint Vincent and the Grenadines on 21 February 1994.[1] The result was a victory for the New Democratic Party, which won twelve of the fifteen seats. Voter turnout was 65.6%.[2]
Results
| Party | Votes | % | Seats | +/– | |
|---|---|---|---|---|---|
| New Democratic Party | 25,789 | 54.95 | 12 | –3 | |
| Saint Vincent Labour Party | 12,455 | 26.54 | 2 | +2 | |
| Movement for National Unity | 8,178 | 17.42 | 1 | +1 | |
| Other parties | 512 | 1.09 | 0 | 0 | |
| Total | 46,934 | 100.00 | 15 | 0 | |
| Valid votes | 46,934 | 99.41 | |||
| Invalid/blank votes | 278 | 0.59 | |||
| Total votes | 47,212 | 100.00 | |||
| Registered voters/turnout | 71,954 | 65.61 | |||
| Source: Caribbean Elections | |||||
References
- ↑ Dieter Nohlen (2005) Elections in the Americas: A data handbook, Volume I, p600 ISBN 978-0-19-928357-6
- ↑ Nohlen, p603
This article is issued from Wikipedia. The text is licensed under Creative Commons - Attribution - Sharealike. Additional terms may apply for the media files.