| ||||||||||||||||||||||||||||||||||||||||
All seats to the municipalities of South Africa | ||||||||||||||||||||||||||||||||||||||||
|---|---|---|---|---|---|---|---|---|---|---|---|---|---|---|---|---|---|---|---|---|---|---|---|---|---|---|---|---|---|---|---|---|---|---|---|---|---|---|---|---|
| ||||||||||||||||||||||||||||||||||||||||
.svg.png.webp) |
|---|
|
|
Municipal elections were held in South Africa in 1995 and 1996. Over 11 000 seats were contested of which the African National Congress won 6 032, the National Party 1 814, the Inkhata Freedom Party 754 and the Democratic Party 138.[1]
The elections were held on 1 November 1995 in most of the country, but delayed to 29 May 1996 in the Western Cape and 26 June 1996 in KwaZulu-Natal due to boundary demarcation disputes.
| Party | Leader | Votes | % | Seats | |
|---|---|---|---|---|---|
| African National Congress | Nelson Mandela | 5,033,855 | 58.02% | 6 032 | |
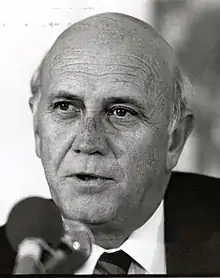
| National Party | Frederik de Klerk | 1,563,465 | 18.02% | 1 814 | |
| Inkatha Freedom Party | Mangosuthu Buthelezi | 757,704 | 8.73% | 754 | |
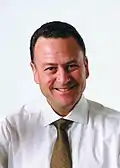
| Democratic Party | Tony Leon | 302,006 | 3.48% | 138 | |
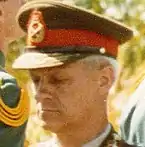
| Freedom Front | Constand Viljoen | 230,845 | 2.66% | 159 | |
| Pan Africanist Congress | Motsoko Pheko | 104,455 | 1.2% | 27 | |
| Conservative Party | Ferdinand Hartzenberg | 68,595 | 0.79% | 57 | |
| African Christian Democratic Party | Kenneth Meshoe | 66,985 | 0.77% | 8 | |
| Others | 422 587 | 4.27% | 1097 | ||
| Total | 8 619 065 | 100.00% | 11 368 | ||
References
This article is issued from Wikipedia. The text is licensed under Creative Commons - Attribution - Sharealike. Additional terms may apply for the media files.


.jpg.webp)

