1997 United Kingdom local elections

1 May 1997 (England)
21 May 1997 (Northern Ireland)

All 34 non-metropolitan counties, 21 out of 46 unitary authorities,
1 out of 238 English districts, 1 sui generis authority
and all 26 Northern Irish districts
  Majority party Minority party Third party
 
Leader Tony Blair John Major Paddy Ashdown
Party Labour Conservative Liberal Democrats
Leader since 21 July 1994 27 November 1990 16 July 1988
Councillors 1,299 1,121 741
Councillors +/- Increase1 Increase193 Decrease177

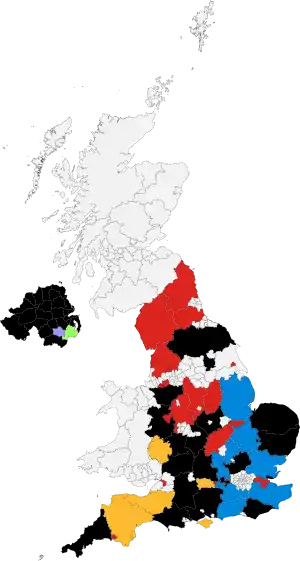
Colours denote the winning party, as shown in the main table of results.

The 1997 United Kingdom local elections took place on Thursday 1 May 1997 in England, and Wednesday 21 May 1997 in Northern Ireland.[1][2] Elections took place for all of the English country councils, some English unitary authorities and all of the Northern Ireland districts. The local elections were held on the same day as the 1997 general election.

Summary of results

Party Councils Councillors
Gain Loss Change Total Gain Loss Change Total
Labour 1 1299
Liberal Democrats -177 741
Conservative 193 1121
Other -17 131
No overall control

[3]

While the results were overshadowed by the landslide election of a Labour government, they did provide some comfort to the Conservative party. The Conservatives made some gains and were the largest party in the county council elections. It is likely that what helped the Conservatives gain some councils (Cambridgeshire, Bedfordshire, Essex and Kent) was the creation of unitary authorities and thus the abolition of county council divisions in these areas (in this case unitaries in Peterborough, Luton, Thurrock and Medway), in predominantly urbanised areas which are usually strong for the Labour Party in elections and indeed all four of those unitaries (and all of the parliamentary seats that they cover) were won/held by Labour at the point these elections took place. Buckinghamshire, the only county council that the Conservatives actually had a majority for the four years prior to these elections, will have also been helped by the creation of a unitary authority for Milton Keynes in 1996.

The gains for the Conservatives in Lincolnshire, Surrey and West Sussex will likely have been helped by the fact that most parliamentary seats in these counties were seriously strong Conservative areas (indeed, every parliamentary seat in Surrey was retained by the Conservatives in the general election) and thus saw some genuine ground recovered compared with the 1993 local elections. The only seats that the Conservatives lost in the general election in these areas were Lincoln and Crawley, both of which were very easy seats for Labour to gain in the general election, while they came close to losing Boston & Skegness to Labour too, though this was far from enough to have made a difference to council control in their respective counties.

England

Non-metropolitan county councils

In 34 non-metropolitan counties the whole council was up for election.

Council Previous control Result Details
Bedfordshire County Council No overall control Conservative gain Details
Buckinghamshire County Council Conservative Conservative hold Details
Cambridgeshire County Council No overall control Conservative gain Details
Cheshire County Council No overall control No overall control hold Details
Cornwall County Council Liberal Democrats No overall control gain Details
Cumbria County Council No overall control Labour gain Details
Derbyshire County Council Labour Labour hold Details
Devon County Council No overall control Liberal Democrats gain Details
Dorset County Council No overall control No overall control hold Details
Durham Labour Labour hold Details
East Sussex County Council No overall control No overall control hold Details
Essex County Council No overall control Conservative gain Details
Gloucestershire County Council No overall control No overall control hold Details
Hampshire County Council No overall control No overall control hold Details
Hertfordshire County Council No overall control No overall control hold Details
Kent County Council No overall control Conservative gain Details
Lancashire County Council Labour Labour hold Details
Leicestershire County Council No overall control No overall control hold Details
Lincolnshire County Council No overall control Conservative gain Details
Norfolk County Council No overall control No overall control hold Details
North Yorkshire County Council No overall control No overall control hold Details
Northamptonshire County Council Labour Labour hold Details
Northumberland County Council Labour Labour hold Details
Nottinghamshire County Council Labour Labour hold Details
Oxfordshire County Council No overall control No overall control hold Details
Shropshire County Council No overall control No overall control hold Details
Somerset County Council Liberal Democrats Liberal Democrats hold Details
Staffordshire County Council Labour Labour hold Details
Suffolk County Council No overall control No overall control hold Details
Surrey County Council No overall control Conservative gain Details
Warwickshire County Council No overall control No overall control hold Details
West Sussex County Council No overall control Conservative gain Details
Wiltshire County Council No overall control No overall control hold Details
Worcestershire County Council No overall control No overall control hold Details

† Elected as a "shadow authority" until 1 April 1998.

‡ Because areas of the county were due to become unitary authorities on 1 April 1998, the county councillors representing those areas had their terms extended by one year and no election was held.

Unitary authorities

Whole council

These were the first elections to 19 more unitary authorities established by the Local Government Commission for England (1992). They acted as "shadow authorities" until 1 April 1998.

Council Previous control Result Details
Blackburn with Darwen New Council Labour Details
Blackpool Council New Council Labour Details
Bracknell Forest Council New Council Conservative Details
Halton Borough Council New Council Labour Details
Herefordshire Council New Council Liberal Democrats Details
Medway Council New Council Labour Details
Nottingham City Council New Council Labour Details
Peterborough City Council New Council Labour Details
Plymouth City Council New Council Labour Details
Reading Borough Council New Council Labour Details
Slough Borough Council New Council Labour Details
Southend-on-Sea Borough Council New Council No overall control Details
Telford and Wrekin Council New Council Labour Details
Thurrock Council New Council Labour Details
Torbay Council New Council Liberal Democrats Details
Warrington Borough Council New Council Labour Details
West Berkshire Council New Council Liberal Democrats Details
Windsor and Maidenhead Borough Council New Council No overall control Details
Wokingham Borough Council New Council Conservative Details

‡ New ward boundaries from predecessor authorities

Third of council

In 2 unitary authorities one third of the council was up for election.

Council Previous control Result Details
Bristol City Council Labour Labour hold Details
Kingston upon Hull Labour Labour hold Details

District council

In 1 district the whole council was up for election.

Council Previous control Result Details
Malvern Hills District Council No overall control No overall control hold Details

‡ New ward boundaries

Sui generis

Council Previous control Result Details
Council of the Isles of Scilly Independent Independent hold Details

Northern Ireland

Council Previous control Result Details
Antrim Borough Council No overall control No overall control Details
Ards No overall control No overall control Details
Armagh No overall control No overall control Details
Ballymena No overall control No overall control Details
Ballymoney No overall control No overall control Details
Banbridge Ulster Unionist Ulster Unionist Details
Belfast No overall control No overall control Details
Carrickfergus No overall control No overall control Details
Castlereagh No overall control No overall control Details
Coleraine Ulster Unionist No overall control Details
Cookstown No overall control No overall control Details
Craigavon No overall control No overall control Details
Derry SDLP No overall control Details
Down SDLP SDLP Details
Dungannon No overall control No overall control Details
Fermanagh No overall control No overall control Details
Larne No overall control No overall control Details
Limavady No overall control No overall control Details
Lisburn Ulster Unionist No overall control Details
Magherafelt No overall control No overall control Details
Moyle No overall control No overall control Details
Newry and Mourne SDLP No overall control Details
Newtownabbey No overall control No overall control Details
North Down No overall control No overall control Details
Omagh No overall control No overall control Details
Strabane No overall control No overall control Details

References

  1. Rallings, Colin; Thrasher, Michael. Local Elections Handbook 1997 (PDF). Local Government Chronicle Elections Centre. Retrieved 3 May 2016.
  2. "Council compositions". The Elections Centre. Retrieved 3 May 2016.
  3. "Local Elections of 1 May 1997 - Parliament.uk" (PDF). researchbriefings.files.parliament.uk/. Parliament UK. 27 June 1997. Retrieved 3 May 2019.
This article is issued from Wikipedia. The text is licensed under Creative Commons - Attribution - Sharealike. Additional terms may apply for the media files.