| ||||||||||||||||||||
| Turnout | 73.73% | |||||||||||||||||||
|---|---|---|---|---|---|---|---|---|---|---|---|---|---|---|---|---|---|---|---|---|
| ||||||||||||||||||||
 | ||||||||||||||||||||
Presidential elections were held in Sri Lanka on 17 November 2005. Nominations were accepted on 7 September 2005 and electoral participation was 73.73%. Prime Minister Mahinda Rajapaksa of the governing United People's Freedom Alliance was elected, receiving 50.3% of all votes cast.
Presidential term controversy
At first, there was doubt whether the election would be held at all. President Chandrika Kumaratunga had called the 1999 election one year ahead of schedule; she argued that the extra year should be appended to her second term, and filed suit to do this. The Supreme Court of Sri Lanka rejected her claims and the election went ahead.
Campaign
Prime Minister Mahinda Rajapaksa quickly emerged as the candidate for the Sri Lanka Freedom Party and Ranil Wickremesinghe for the United National Party. Both candidates tried to round up the support of minor parties. Rajapaksa needed to re-assemble the alliance with the Janatha Vimukthi Peramuna that existed at the parliamentary level (the United People's Freedom Alliance). After he agreed to reject federalism and renegotiate the ceasefire with the Liberation Tigers of Tamil Eelam, the JVP and the Jathika Hela Urumaya endorsed him.
After that, Wickremesinghe's only hope of victory was through the support of the island's ethnic minorities, given his generally more conciliatory stance on the ethnic issue. He secured the endorsement of the main Muslim party, the Sri Lanka Muslim Congress, and the Ceylon Workers' Congress representing the estate Tamils. He could not, however, obtain the backing of the main Sri Lankan Tamil party, the Tamil National Alliance. Any hopes for Wickremesinghe's victory were effectively dashed when the LTTE ordered Tamil voters, most of whom would likely have voted for him, to boycott the polls.
Economic issues also worked to Rajapaksa's favour. Sri Lanka had enjoyed strong growth under Wickremesinghe's free-market policies when he was prime minister from 2001 to 2004, but he had also pursued controversial privatizations which Rajapaksa promised to halt. Rajapaksa also promised a policy of economic nationalism.
Results
| Candidate | Party | Votes | % | |
|---|---|---|---|---|
| Mahinda Rajapaksa | Sri Lanka Freedom Party | 4,887,152 | 50.29 | |
| Ranil Wickremesinghe | United National Party | 4,706,366 | 48.43 | |
| Siritunga Jayasuriya | United Socialist Party | 35,425 | 0.36 | |
| A. A. Suraweera | National Development Front | 31,238 | 0.32 | |
| Victor Hettigoda | United Lanka People's Party | 14,458 | 0.15 | |
| Chamil Jayaneththi | New Left Front | 9,296 | 0.10 | |
| Aruna de Soyza | Ruhuna People's Party | 7,685 | 0.08 | |
| Wimal Geeganage | Sri Lanka National Front | 6,639 | 0.07 | |
| Anura de Silva | United Lalith Front | 6,357 | 0.07 | |
| Ajith Arachchige | Democratic Unity Alliance | 5,082 | 0.05 | |
| Wije Dias | Socialist Equality Party | 3,500 | 0.04 | |
| Nelson Perera | Sri Lanka Progressive Front | 2,525 | 0.03 | |
| Hewaheenipellage Dharmadwaja | United National Alternative Front | 1,316 | 0.01 | |
| Total | 9,717,039 | 100.00 | ||
| Valid votes | 9,717,039 | 98.88 | ||
| Invalid/blank votes | 109,739 | 1.12 | ||
| Total votes | 9,826,778 | 100.00 | ||
| Registered voters/turnout | 13,327,160 | 73.73 | ||
| Source: Election Commission | ||||
District results
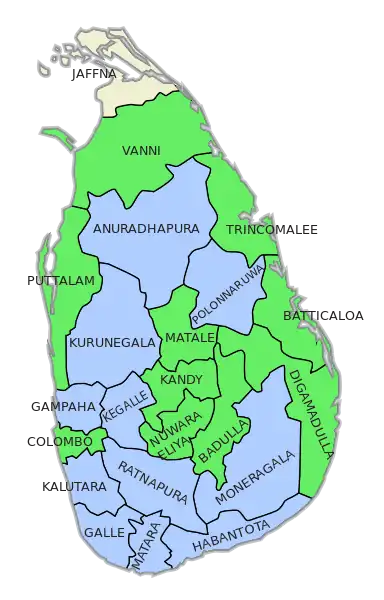
| Districts won by Rajapaksa |
| Districts won by Wickremesinghe |
| District | Province | Rajapaksa | Wickremesinghe | Others | Turnout | |||
|---|---|---|---|---|---|---|---|---|
| Votes | % | Votes | % | Votes | % | |||
| Colombo | Western | 534,431 | 47.96% | 569,627 | 51.12% | 10,192 | 0.92% | 76.75% |
| Gampaha | Western | 596,698 | 54.78% | 481,764 | 44.23% | 10,815 | 0.99% | 80.71% |
| Kalutara | Western | 341,693 | 55.48% | 266,043 | 43.20% | 8,124 | 1.32% | 81.43% |
| Kandy | Central | 315,672 | 44.30% | 387,150 | 54.33% | 9,798 | 1.37% | 79.65% |
| Matale | Central | 120,533 | 48.09% | 125,937 | 50.25% | 4,150 | 1.66% | 79.04% |
| Nuwara Eliya | Central | 99,550 | 27.97% | 250,428 | 70.37% | 5,897 | 1.66% | 80.78% |
| Galle | Southern | 347,223 | 58.41% | 239320 | 40.26% | 7,925 | 1.33% | 81.94% |
| Matara | Southern | 279411 | 61.85% | 165827 | 36.71% | 6,484 | 1.44% | 80.96% |
| Hambantota | Southern | 202,918 | 63.43% | 112,712 | 35.23% | 4,295 | 1.34% | 81.41% |
| Jaffna | Northern | 1,967 | 25.00% | 5,523 | 70.20% | 1,034 | 4.8% | 1.21% |
| Vanni | Northern | 17,197 | 20.36% | 65,798 | 77.89% | 2,879 | 1.75% | 34.30% |
| Batticaloa | Eastern | 28,836 | 18.87% | 121,514 | 79.51% | 4,265 | 1.62% | 48.51% |
| Ampara | Eastern | 122,329 | 42.88% | 159,198 | 55.81% | 6,681 | 1.31% | 72.7% |
| Trincomalee | Eastern | 55,680 | 37.04% | 92,197 | 61.33% | 4,551 | 1.63% | 63.84% |
| Kurunegala | North Western | 468,507 | 52.56% | 418,809 | 46.72% | 17,639 | 0.72% | 80.51% |
| Puttalam | North Western | 160,686 | 48.14% | 169,264 | 50.71% | 3,833 | 1.15% | 71.68% |
| Anuradhapura | North Central | 231,040 | 55.08% | 182,956 | 42.62% | 5,438 | 2.3% | 78.98% |
| Polonnaruwa | North Central | 110,499 | 52.61% | 97,142 | 46.25% | 2,389 | 1.14% | 80.43% |
| Badulla | Uva | 192,734 | 45.18% | 226,582 | 53.11% | 7,283 | 1.71% | 81.29% |
| Monaragala | Uva | 126,094 | 56.94% | 92,244 | 41.65% | 3,112 | 1.41% | 81.16% |
| Ratnapura | Sabaragamuwa | 294,260 | 53.01% | 252,838 | 45.55% | 7,976 | 1.44% | 83.89% |
| Kegalle | Sabaragamuwa | 239,184 | 51.02% | 223,483 | 47.67% | 6,106 | 1.31% | 81.19% |
| Total | 4,887,152 | 50.29% | 4,706,366 | 48.43% | 123,521 | 1.28% | 73.73% | |
Maps
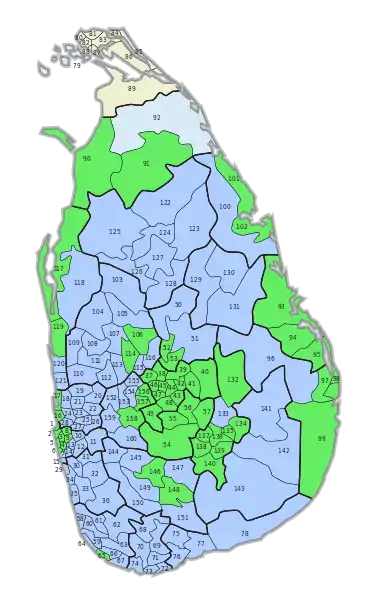
 Winners of polling divisions
 Majorities according to polling divisions
 Majorities according to electoral districts
References
- ↑ "Result of Presidential Election 2005 (District)" (PDF). Department of Elections, Sri Lanka. Archived from the original (PDF) on 2009-03-04. Retrieved 2010-09-03.
- "Result of Presidential Election 2005 (District)" (PDF). Department of Elections, Sri Lanka. Archived from the original (PDF) on 2009-03-04.
- "Sri Lanka Election Results 2005 - Live Update". LankaNewspapers.com. 12 July 2023.
- "2005 - Presidential Election". Manthree.com.
- "DEMOCRATIC SOCIALIST REPUBLIC OF SRI LANKA PRESIDENTIAL ELECTIONS OF 17 NOVEMBER 2005". Psephos - Adam Carr's Election Archive.

.jpg.webp)
