| |||||||||||||||||||||||||||||||
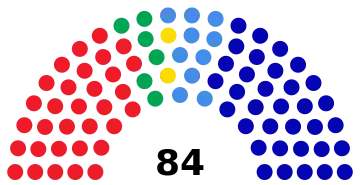
All 84 seats in the Legislative Assembly 43 seats needed for a majority | |||||||||||||||||||||||||||||||
This lists parties that won seats. See the complete results below. | |||||||||||||||||||||||||||||||
 |
|---|
|
|
Legislative elections were held in El Salvador on 12 March 2006.[1] Although the Farabundo Martí National Liberation Front received the most votes, the Nationalist Republican Alliance emerged as the largest party, winning 34 of the 84 seats.
Results
 | |||||
|---|---|---|---|---|---|
| Party | Votes | % | Seats | +/– | |
| Farabundo Martí National Liberation Front | 785,072 | 39.29 | 32 | +1 | |
| Nationalist Republican Alliance | 783,230 | 39.20 | 34 | +7 | |
| National Conciliation Party | 228,196 | 11.42 | 10 | –6 | |
| Christian Democratic Party | 138,538 | 6.93 | 6 | +1 | |
| Democratic Change | 61,022 | 3.05 | 2 | New | |
| National Liberal Party | 1,956 | 0.10 | 0 | New | |
| Total | 1,998,014 | 100.00 | 84 | 0 | |
| Valid votes | 1,998,014 | 96.95 | |||
| Invalid/blank votes | 62,875 | 3.05 | |||
| Total votes | 2,060,889 | 100.00 | |||
| Registered voters/turnout | 3,801,040 | 54.22 | |||
| Source: TSE, Election Resources | |||||
References
- ↑ Elections held in 2006 Inter-Parliamentary Union
This article is issued from Wikipedia. The text is licensed under Creative Commons - Attribution - Sharealike. Additional terms may apply for the media files.