| |||||||||||||||||||||
One third of seats to Bassetlaw District Council (16 seats) 25 seats needed for a majority | |||||||||||||||||||||
|---|---|---|---|---|---|---|---|---|---|---|---|---|---|---|---|---|---|---|---|---|---|
| Turnout | 30.8% | ||||||||||||||||||||
| |||||||||||||||||||||
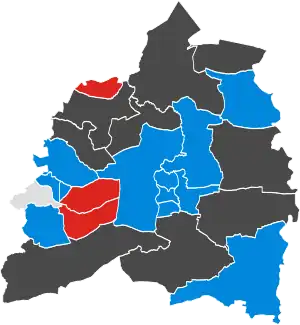 No election Colours denote the winning party, as shown in the main table of results. | |||||||||||||||||||||
| |||||||||||||||||||||
The 2008 Bassetlaw District Council election took place on 1 May 2008 to elect members of Bassetlaw District Council in Nottinghamshire, England. One third of the council was up for election.
Election result
| Overall result | ||||
|---|---|---|---|---|
| Party | Seats (2008) |
Seats (Council) |
Seats (Change) | |
| Conservative | 12 | 30 | +3 | |
| Labour | 3 | 16 | - | |
| Independent | 1 | 2 | -3 | |
| Registered electors | 67,876 | |||
| Votes cast | 20,936 | |||
| Turnout | 30.8% | |||
Ward results
Beckingham
| Party | Candidate | Votes | % | ±% | |
|---|---|---|---|---|---|
| Conservative | Kenneth Bullivant | 518 | 70.38 | ||
| Labour | Joan Sanger | 218 | 29.62 | ||
| Turnout | 736 | 35.2% | |||
| Registered electors | 1,801 | ||||
Carlton
| Party | Candidate | Votes | % | ±% | |
|---|---|---|---|---|---|
| Conservative | Val Bowles | 980 | 60.1% | ||
| Labour | Maurice Stocks | 650 | 39.9% | ||
| Turnout | 1,630 | 51.8% | |||
| Registered electors | 4,660 | ||||
Clayworth
| Party | Candidate | Votes | % | ±% | |
|---|---|---|---|---|---|
| Conservative | Kath Sutton | 461 | 56.8% | ||
| BNP | David Otter | 243 | 30.0% | ||
| Labour | Philip Goodliffe | 107 | 13.2% | ||
| Turnout | 811 | 51.8% | |||
| Registered electors | 1,568 | ||||
East Retford East
| Party | Candidate | Votes | % | ±% | |
|---|---|---|---|---|---|
| Conservative | Mike Quigley | 1,148 | 57.7% | ||
| Independent | Michael Jenkins | 422 | 21.2% | ||
| Labour | Robert Clyndes | 420 | 21.1% | ||
| Turnout | 1,990 | 36.9% | |||
| Registered electors | 5,409 | ||||
East Retford North
| Party | Candidate | Votes | % | ±% | |
|---|---|---|---|---|---|
| Conservative | Anthony Tromans | 965 | 57.9% | ||
| Labour | Pamela Skelding | 703 | 42.2% | ||
| Turnout | 1,668 | 34.4% | |||
| Registered electors | 4,847 | ||||
East Retford South
| Party | Candidate | Votes | % | ±% | |
|---|---|---|---|---|---|
| Conservative | Bryn Jones | 526 | 53.4% | ||
| Labour | Philip Skelding | 459 | 46.6% | ||
| Turnout | 985 | 30.0% | |||
| Registered electors | 3,279 | ||||
East Retford West
| Party | Candidate | Votes | % | ±% | |
|---|---|---|---|---|---|
| Conservative | Perry Offer | 570 | 63.8% | ||
| Labour | Rod Pickford | 324 | 36.2% | ||
| Turnout | 894 | 25.8% | |||
| Registered electors | 3,483 | ||||
Harworth
| Party | Candidate | Votes | % | ±% | |
|---|---|---|---|---|---|
| Labour | David Challinor | 1,009 | 64.0% | ||
| Conservative | Tracey Taylor | 568 | 36.0% | ||
| Turnout | 1,577 | 27.1% | |||
| Registered electors | 5,851 | ||||
Sutton
| Party | Candidate | Votes | % | ±% | |
|---|---|---|---|---|---|
| Conservative | Liz Yates | Unopposed | |||
Tuxford and Trent
| Party | Candidate | Votes | % | ±% | |
|---|---|---|---|---|---|
| Conservative | Shirley Isard | 756 | 71.6% | ||
| Labour | Marilyn McCarthy | 300 | 28.4% | ||
| Turnout | 1,056 | 31.5% | |||
| Registered electors | 3,390 | ||||
Worksop East
| Party | Candidate | Votes | % | ±% | |
|---|---|---|---|---|---|
| Labour | John Scott | 663 | 41.4% | ||
| Independent | Geoff Coe | 581 | 36.3% | ||
| Independent | Geoff Hurst | 357 | 22.3% | ||
| Turnout | 1,601 | 31.6% | |||
| Registered electors | 5,081 | ||||
Worksop North
| Party | Candidate | Votes | % | ±% | |
|---|---|---|---|---|---|
| Conservative | Vicky Wanless | 907 | 51.8% | ||
| Labour | David Potts | 843 | 48.2% | ||
| Turnout | 1,750 | 27.1% | |||
| Registered electors | 6,530 | ||||
Worksop North East
| Party | Candidate | Votes | % | ±% | |
|---|---|---|---|---|---|
| Conservative | Bill Graham | 926 | 53.2% | ||
| Labour | Shirley Toms | 813 | 46.8% | ||
| Turnout | 1,739 | 34.3% | |||
| Registered electors | 5,097 | ||||
Worksop North West
| Party | Candidate | Votes | % | ±% | |
|---|---|---|---|---|---|
| Independent | Ivor Jones | 961 | 61.4% | ||
| Labour | Robin Carrington-Wilde | 604 | 38.6% | ||
| Turnout | 1,565 | 28.7% | |||
| Registered electors | 5,635 | ||||
Worksop South
| Party | Candidate | Votes | % | ±% | |
|---|---|---|---|---|---|
| Conservative | Michael Bennett | 1,372 | 78.2% | ||
| Labour | Eileen Hart | 383 | 21.8% | ||
| Turnout | 1,755 | 32.0% | |||
| Registered electors | 5,518 | ||||
Worksop South East
| Party | Candidate | Votes | % | ±% | |
|---|---|---|---|---|---|
| Labour | John Shephard | 858 | 72.8% | ||
| Conservative | Philip Smith | 321 | 27.2% | ||
| Turnout | 1,179 | 20.8% | |||
| Registered electors | 5,727 | ||||
References
This article is issued from Wikipedia. The text is licensed under Creative Commons - Attribution - Sharealike. Additional terms may apply for the media files.