| |||||||||||||||||||||||||||||||||||||||||||||||||||||
24 seats on Fingal County Council | |||||||||||||||||||||||||||||||||||||||||||||||||||||
|---|---|---|---|---|---|---|---|---|---|---|---|---|---|---|---|---|---|---|---|---|---|---|---|---|---|---|---|---|---|---|---|---|---|---|---|---|---|---|---|---|---|---|---|---|---|---|---|---|---|---|---|---|---|
| |||||||||||||||||||||||||||||||||||||||||||||||||||||
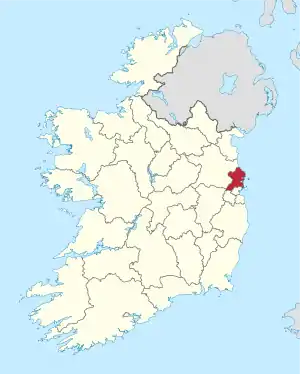 Map showing the area of Fingal County Council | |||||||||||||||||||||||||||||||||||||||||||||||||||||
| |||||||||||||||||||||||||||||||||||||||||||||||||||||
An election to all 24 seats on Fingal County Council took place on 5 June 2009 as part of the 2009 Irish local elections. Fingal was divided into 5 local electoral areas (LEAs) to elect councillors for a five-year term of office on the electoral system of proportional representation by means of the single transferable vote (PR-STV).
Results by party
| Party | Seats | ± | 1st pref | FPv% | ±% | |
|---|---|---|---|---|---|---|
| Labour | 9 | 21,117 | 25.66 | |||
| Fine Gael | 6 | 17,133 | 20.82 | |||
| Fianna Fáil | 4 | 13,347 | 16.22 | |||
| Socialist Party | 3 | 11,502 | 13.98 | |||
| Green | 0 | 4,861 | 5.91 | |||
| Sinn Féin | 0 | 4,037 | 4.91 | |||
| Seniors Solidarity | 0 | 1,319 | 1.60 | |||
| Progressive Democrats | — | — | — | |||
| Independent | 2 | 8,966 | 10.90 | |||
| Total | 24 | 82,282 | 100.00 | — | ||
Results by local electoral area
Balbriggan
| Party | Candidate | FPv% | Count | |||||||||
|---|---|---|---|---|---|---|---|---|---|---|---|---|
| 1 | 2 | 3 | 4 | 5 | 6 | 7 | 8 | 9 | ||||
| Labour | Ken Farrell | 19.14 | 3,388 | |||||||||
| Independent | David O'Connor* | 12.94 | 2,291 | 2,346 | 2,388 | 2,454 | 2,541 | 2,623 | 2,800 | 3,035 | ||
| Fine Gael | Tom O'Leary | 10.36 | 1,833 | 1,874 | 1,903 | 1,926 | 2,005 | 2,513 | 2,586 | 2,689 | 2,877 | |
| Green | Joe Corr* | 8.65 | 1,531 | 1,581 | 1,610 | 1,671 | 1,766 | 1,817 | 1,928 | 2,040 | 2,306 | |
| Labour | Ciaran Byrne* | 8.02 | 1,420 | 1,515 | 1,752 | 1,857 | 1,887 | 1,975 | 2,238 | 2,447 | 2,585 | |
| Independent | May McKeon* | 6.99 | 1,238 | 1,249 | 1,315 | 1,366 | 1,401 | 1,514 | 1,636 | 2,040 | 2,432 | |
| Independent | Seán Brown | 6.07 | 1,075 | 1,082 | 1,125 | 1,200 | 1,211 | 1,300 | 1,424 | |||
| Fine Gael | Larry Dunne | 5.71 | 1,010 | 1,024 | 1,059 | 1,087 | 1,108 | |||||
| Fianna Fáil | Dermot Murray | 5.56 | 985 | 993 | 1,012 | 1,046 | 1,491 | 1,551 | 1,584 | 1,694 | ||
| Socialist Party | Terry Kelleher | 4.98 | 882 | 905 | 941 | 1,097 | 1,109 | 1,136 | ||||
| Fianna Fáil | Stephen O'Connell | 4.79 | 848 | 894 | 898 | 911 | ||||||
| Sinn Féin | Fergus Byrne | 3.82 | 677 | 691 | 710 | |||||||
| Labour | Grainne Kilmurray | 2.95 | 523 | 596 | ||||||||
| Electorate: 36,258 Valid: 17,701 (48.82%) Spoilt: 248 Quota: 2,951 Turnout: 17,949 (49.50%) | ||||||||||||
Castleknock
| Party | Candidate | FPv% | Count | ||||||
|---|---|---|---|---|---|---|---|---|---|
| 1 | 2 | 3 | 4 | 5 | 6 | ||||
| Socialist Party | Joe Higgins | 28.07 | 3,787 | ||||||
| Fine Gael | Eithne Loftus* | 22.45 | 3,028 | ||||||
| Labour | Peggy Hamill* | 16.32 | 2,201 | 2,753 | |||||
| Fianna Fáil | Mags Murray* | 12.44 | 1,678 | 1,766 | 1,787 | 1,869 | 1,952 | 2,692 | |
| Green | Roderic O'Gorman | 9.18 | 1,238 | 1,413 | 1,458 | 1,649 | 1,851 | 2,030 | |
| Fianna Fáil | Howard Mahony | 6.95 | 938 | 983 | 997 | 1,033 | 1,077 | ||
| Sinn Féin | Charlie Maples | 3.59 | 484 | 657 | 694 | 714 | |||
| Independent | Zahid Hussain | 1.01 | 136 | 191 | |||||
| Electorate: 29,622 Valid: 13,490 (45.54%) Spoilt: 138 Quota: 2,699 Turnout: 13,628 (46.01%) | |||||||||
Howth–Malahide
| Party | Candidate | FPv% | Count | ||||||||||
|---|---|---|---|---|---|---|---|---|---|---|---|---|---|
| 1 | 2 | 3 | 4 | 5 | 6 | 7 | 8 | 9 | 10 | ||||
| Labour | Peter Coyle* | 16.99 | 3,781 | ||||||||||
| Fine Gael | Alan Farrell* | 12.31 | 2,739 | 2,754 | 2,795 | 2,832 | 2,859 | 2,948 | 3,002 | 3,161 | 3,387 | 3,499 | |
| Fianna Fáil | Eoghan O'Brien* | 10.26 | 2,283 | 2,288 | 2,311 | 2,338 | 2,360 | 2,421 | 2,440 | 2,500 | 2,592 | 3,634 | |
| Labour | Cian O'Callaghan | 10.14 | 2,256 | 2,275 | 2,283 | 2,354 | 2,458 | 2,507 | 2,859 | 3,251 | 3,610 | 3,818 | |
| Fine Gael | Joan Maher* | 10.66 | 2,372 | 2,376 | 2,383 | 2,454 | 2,478 | 2,515 | 2,582 | 2,821 | 3,058 | 3,283 | |
| Independent | Jimmy Guerin | 8.15 | 1,814 | 1,820 | 1,842 | 1,984 | 2,062 | 2,099 | 2,279 | 2,445 | 2,871 | 3,052 | |
| Fianna Fáil | Averil Power | 7.46 | 1,659 | 1,662 | 1,669 | 1,710 | 1,743 | 1,766 | 1,826 | 1,923 | 2,033 | ||
| Seniors Solidarity Party | John Wolfe | 5.93 | 1,319 | 1,325 | 1,345 | 1,422 | 1,501 | 1,537 | 1,721 | 1,835 | |||
| Socialist Party | Brian Greene | 4.64 | 1,032 | 1,036 | 1,044 | 1,063 | 1,207 | 1,229 | |||||
| Green | David Healy* | 4.32 | 962 | 965 | 972 | 1,009 | 1,041 | 1,329 | 1,450 | ||||
| Sinn Féin | Colm O Murchadha | 2.87 | 638 | 639 | 643 | 653 | |||||||
| Green | Robbie Kelly* | 2.77 | 616 | 619 | 632 | 661 | 683 | ||||||
| Independent | Eamonn McKiernan | 1.53 | 341 | 342 | 359 | ||||||||
| Independent | John Seery | 1.07 | 237 | 238 | 251 | ||||||||
| Independent | Pat Joyce | 0.91 | 202 | 203 | |||||||||
| Electorate: 41,843 Valid: 22,251 (53.18%) Spoilt: 201 Quota: 3,709 Turnout: 22,452 (53.66%) | |||||||||||||
The Seniors Solidarity Party was founded in November 2008 by John Wolfe following changes to the medical card changes in the 2009 budget.[1] It was registered to contest local elections in Dublin.[2] This was the only election it contested. In December 2014, the registrar of political parties proposed to cancel its registration.[3]
Mulhuddart
| Party | Candidate | FPv% | Count | |||||||
|---|---|---|---|---|---|---|---|---|---|---|
| 1 | 2 | 3 | 4 | 5 | 6 | 7 | ||||
| Labour | Patrick Nulty | 14.32 | 1,898 | 1,924 | 1,957 | 1,965 | 2,014 | 2,065 | 2,178 | |
| Socialist Party | Ruth Coppinger* | 12.86 | 1,705 | 1,733 | 1,784 | 1,795 | 2,241 | |||
| Labour | Michael O'Donovan* | 12.80 | 1,696 | 1,708 | 1,749 | 1,758 | 1,785 | 1,845 | 1,987 | |
| Fine Gael | Kieran Dennison | 12.44 | 1,649 | 1,661 | 1,698 | 1,707 | 1,726 | 1,803 | 2,320 | |
| Sinn Féin | Paul Donnelly* | 11.44 | 1,517 | 1,532 | 1,557 | 1,565 | 1,641 | 1,672 | 1,699 | |
| Fianna Fáil | David McGuinness | 9.08 | 1,203 | 1,213 | 1,225 | 1,337 | 1,347 | 1,850 | 1,999 | |
| Fine Gael | Adeola Ogunsina | 7.28 | 965 | 974 | 1,083 | 1,294 | 1,297 | 1,368 | ||
| Fianna Fáil | Niamh Moran | 5.45 | 723 | 729 | 760 | 885 | 890 | |||
| Socialist Party | Denis Keane | 4.84 | 642 | 656 | 667 | 667 | ||||
| Fianna Fáil | Idowu Sulyman Olafimihan | 4.61 | 611 | 611 | 653 | |||||
| Independent | Iggy Okafor | 3.50 | 464 | 491 | ||||||
| Independent | Maria McGrail | 1.37 | 182 | |||||||
| Electorate: 30,735 Valid: 13,255 (43.13%) Spoilt: 172 Quota: 2,210 Turnout: 13,427 (43.69%) | ||||||||||
Swords
| Party | Candidate | FPv% | Count | ||||||||||
|---|---|---|---|---|---|---|---|---|---|---|---|---|---|
| 1 | 2 | 3 | 4 | 5 | 6 | 7 | 8 | 9 | 10 | ||||
| Socialist Party | Clare Daly* | 20.48 | 3,192 | ||||||||||
| Labour | Gerry McGuire* | 10.09 | 1,572 | 1,617 | 1,623 | 1,678 | 1,737 | 1,848 | 1,923 | 2,322 | 2,433 | 2,670 | |
| Labour | Tom Kelleher* | 10.02 | 1,561 | 1,637 | 1,658 | 1,705 | 1,790 | 1,916 | 1,993 | 2,221 | 2,342 | 2,616 | |
| Fianna Fáil | Darragh Butler* | 9.54 | 1,487 | 1,508 | 1,517 | 1,525 | 1,590 | 1,628 | 2,154 | 2,212 | 2,285 | 2,448 | |
| Fine Gael | Anne Devitt* | 8.75 | 1,364 | 1,404 | 1,426 | 1,440 | 1,496 | 1,539 | 1,601 | 1,659 | 2,028 | 2,155 | |
| Fine Gael | Bob Dowling | 7.92 | 1,234 | 1,257 | 1,262 | 1,266 | 1,300 | 1,323 | 1,353 | 1,375 | 1,645 | 1,728 | |
| Fine Gael | James Lawless | 6.03 | 939 | 960 | 971 | 986 | 1,030 | 1,056 | 1,104 | 1,164 | |||
| Fianna Fáil | John Hennessy | 5.98 | 932 | 951 | 961 | 969 | 996 | 1,031 | |||||
| Labour | Pat Ward | 5.27 | 821 | 861 | 868 | 921 | 957 | 1,043 | 1,081 | ||||
| Independent | Joe O'Neill | 4.70 | 733 | 773 | 883 | 919 | 982 | 1,153 | 1,221 | 1,309 | 1,390 | ||
| Sinn Féin | Conor Kelly | 4.63 | 721 | 776 | 778 | 863 | 895 | ||||||
| Green | Kenneth Duffy | 3.30 | 514 | 542 | 569 | 584 | |||||||
| Socialist Party | John McCamley | 1.68 | 262 | 421 | 433 | ||||||||
| Independent | Carmel Diviney | 1.62 | 253 | 280 | |||||||||
| Electorate: 35,652 Valid: 15,585 (43.71%) Spoilt: 157 Quota: 2,598 Turnout: 15,742 (44.15%) | |||||||||||||
References
Sources
- Department of the Environment, Heritage and Local Government (2010). "Volume 1: City and County Councils". Local Elections 2009: Results, Transfer of Votes and Statistics (PDF). Dublin: Stationery Office. ISBN 9781406425109. Archived from the original (PDF) on 8 May 2014.
Citations
- ↑ "John Wolfe, Senior Solidarity Party". Fingal Independent. 20 May 2009. Archived from the original on 29 May 2009. Retrieved 25 May 2009.
- ↑ "Register of Political Parties". Iris Oifigiúil. 2009 (18): 280. 3 March 2009.
- ↑ "Register of Political Parties". Iris Oifigiúil. 2014 (103): 3017. 26 December 2014.
This article is issued from Wikipedia. The text is licensed under Creative Commons - Attribution - Sharealike. Additional terms may apply for the media files.