| ||||||||||||||||||||||||||||||||||
All 80 seats in the New Jersey General Assembly 41 seats needed for a majority | ||||||||||||||||||||||||||||||||||
|---|---|---|---|---|---|---|---|---|---|---|---|---|---|---|---|---|---|---|---|---|---|---|---|---|---|---|---|---|---|---|---|---|---|---|
| ||||||||||||||||||||||||||||||||||
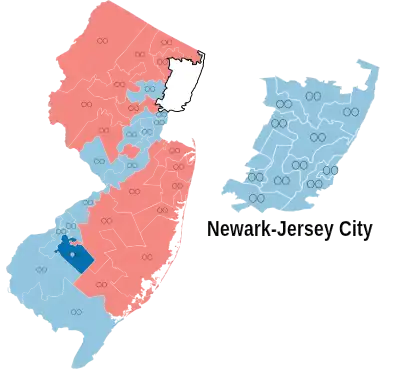 Results: Democratic hold Democratic gain Republican hold | ||||||||||||||||||||||||||||||||||
| ||||||||||||||||||||||||||||||||||


All 80 seats in the General Assembly were up for election this year. In each Legislative district, there are two people elected; the top two winners in the general election are the ones sent to the Assembly. Typically, the two members of each party run as a team in each election. After the previous election, Democrats captured 47 seats while the Republicans won 33 seats. These were the first elections to be held after the 2010 redistricting cycle.
Democrats gained one seat, by flipping a seat in the 4th district, which they had only lost two years prior.
Incumbents not seeking re-election
Democratic
- Jack Conners, District 7
- Joan M. Quigley, District 32
- Caridad Rodriguez, District 33
- Elease Evans, District 35
- Nellie Pou, District 35 (ran for State Senate)
- Kevin J. Ryan, District 36
- Joan Voss, District 38 (ran for Bergen County Freeholder)
Republican
- Vincent J. Polistina, District 2 (ran for State Senate)
- Patrick Delany, District 8
- James Holzapfel, District 10 (ran for State Senate)
- Samuel D. Thompson, District 13 (ran for State Senate)
Overall results
Summary of the November 8, 2011 New Jersey General Assembly election results:[2]
| 48 | 32 |
| Democratic | Republican |
| Parties | Candidates | Seats | Popular Vote | ||||||
|---|---|---|---|---|---|---|---|---|---|
| 2009 | 2011 | +/- | Strength | Vote | % | Change | |||
| Democratic | 80 | 47 | 48 | 60% | 1,339,201 | 51.2% | |||
| Republican | 79 | 33 | 32 | 40% | 1,253,824 | 48.0% | |||
| Green | 2 | 0 | 0 | 0% | 2,284 | 0.1% | |||
| Libertarian | 4 | 0 | 0 | 0% | 3,692 | 0.1% | |||
| Independent | 10 | 0 | 0 | 0% | 15,310 | 0.6% | |||
| Total | 176 | 80 | 80 | 0 | 100.0% | 2,614,311 | 100.0% | - | |
Summary of results by district
Close races
Districts where the difference of total votes between the top-two parties was under 10%:
- District 7, 3.6%
- District 1, 5.6%%
- District 16, 6.0%
- District 11, 6.4%
- District 3, 9.2%
List of races
|
District 1 • District 2 • District 3 • District 4 • District 5 • District 6 • District 7 • District 8 • District 9 • District 10 • District 11 • District 12 • District 13 • District 14 • District 15 • District 16 • District 17 • District 18 • District 19 • District 20 • District 21 • District 22 • District 23 • District 24 • District 25 • District 26 • District 27 • District 28 • District 29 • District 30 • District 31 • District 32 • District 33 • District 34 • District 35 • District 36 • District 37 • District 38 • District 39 • District 40 |
Voters in each legislative district elect two members to the New Jersey General Assembly.
District 1
| Party | Candidate | Votes | % | |
|---|---|---|---|---|
| Democratic | Nelson Albano (incumbent) | 24,794 | 27.9 | |
| Democratic | Matthew Milam (incumbent) | 22,207 | 24.9 | |
| Republican | Sam Fiocchi | 21,156 | 23.7 | |
| Republican | Suzanne Walters | 20,810 | 23.3 | |
| Total votes | 88,967 | 100.0 | ||
| Democratic hold | ||||
District 2
| Party | Candidate | Votes | % | |
|---|---|---|---|---|
| Republican | John F. Amodeo | 25,330 | 29.2 | |
| Republican | Chris A. Brown | 23,440 | 27.1 | |
| Democratic | Damon Tyner | 19,919 | 23.0 | |
| Democratic | Alisa Cooper | 17,933 | 20.7 | |
| Total votes | 86,622 | 100.0 | ||
| Republican hold | ||||
District 3
| Party | Candidate | Votes | % | |
|---|---|---|---|---|
| Democratic | John J. Burzichelli (incumbent) | 25,172 | 28.0 | |
| Democratic | Celeste Riley (incumbent) | 23,960 | 26.6 | |
| Republican | Bob Villare | 20,528 | 22.6 | |
| Republican | Domenick DiCicco (incumbent) | 20,268 | 22.5 | |
| Total votes | 125,153 | 100.0 | ||
| Democratic hold | ||||
District 4
| Party | Candidate | Votes | % | |||
|---|---|---|---|---|---|---|
| Democratic | Paul D. Moriarty (incumbent) | 22,734 | 30.0 | |||
| Democratic | Gabriela Mosquera | 21,461 | 28.3 | |||
| Republican | Shelley Lovett | 15,106 | 19.9 | |||
| Republican | Patricia Fratticcioli | 14,724 | 19.4 | |||
| Family, Freedom, Community | Tony Celeste | 1,843 | 2.4 | |||
| Total votes | 75,689 | 100.0 | ||||
| One Democratic gain from Republican | ||||||
District 5
| Party | Candidate | Votes | % | |
|---|---|---|---|---|
| Democratic | Gilbert Wilson (incumbent) | 17,691 | 28.7 | |
| Democratic | Angel Fuentes (incumbent) | 17,586 | 28.5 | |
| Republican | William Levins | 13,575 | 22.1 | |
| Republican | Terrell Ratliff | 12,776 | 20.7 | |
| Total votes | 61,628 | 100.0 | ||
| Democratic hold | ||||
District 6
| Party | Candidate | Votes | % | |
|---|---|---|---|---|
| Democratic | Louis Greenwald (incumbent) | 24 272 | 30.0 | |
| Democratic | Pamela Rosen Lampitt (incumbent) | 23,342 | 28.9 | |
| Republican | Allan Richardson | 16,714 | 20.7 | |
| Republican | Gregory Horton | 16,461 | 20.4 | |
| Total votes | 80,789 | 100.0 | ||
| Democratic hold | ||||
District 7
| Party | Candidate | Votes | % | |
|---|---|---|---|---|
| Democratic | Herb Conaway (incumbent) | 23,908 | 26.2 | |
| Democratic | Troy Singleton | 23,403 | 25.6 | |
| Republican | James Keenan | 22,144 | 24.3 | |
| Republican | Christopher Halgas | 21,828 | 23.9 | |
| Total votes | 91,283 | 100.0 | ||
| Democratic hold | ||||
District 8
| Party | Candidate | Votes | % | |
|---|---|---|---|---|
| Republican | Christopher J. Brown | 19,799 | 30.2 | |
| Republican | Scott Rudder (incumbent) | 19,649 | 29.9 | |
| Democratic | Pam Finnerly | 12,480 | 19.1 | |
| Democratic | Anita Lovely | 12,107 | 18.5 | |
| Independent | Robert Edward Forchion Jr. | 1,653 | 2.5 | |
| Total votes | 65,508 | 100.0 | ||
| Republican hold | ||||
District 9
| Party | Candidate | Votes | % | |
|---|---|---|---|---|
| Republican | Brian E. Rumpf (incumbent) | 30,896 | 32.3 | |
| Republican | DiAnne Gove (incumbent) | 29,898 | 31.2 | |
| Democratic | Carla Kearny | 17,648 | 18.4 | |
| Democratic | Bradley Billhimer | 17,338 | 18.1 | |
| Total votes | 95,780 | 100.0 | ||
| Republican hold | ||||
District 10
| Party | Candidate | Votes | % | |
|---|---|---|---|---|
| Republican | David W. Wolfe (incumbent) | 27,955 | 32.0 | |
| Republican | Gregory P. McGuckin | 26,831 | 30.7 | |
| Democratic | Bette Wary | 16,909 | 19.3 | |
| Democratic | Eli Eytan | 15,698 | 18.0 | |
| Total votes | 87,393 | 100.0 | ||
| Republican hold | ||||
District 11
| Party | Candidate | Votes | % | |
|---|---|---|---|---|
| Republican | Caroline Casagrande (incumbent) | 18,739 | 26.8 | |
| Republican | Mary Pat Angelini (incumbent) | 18,479 | 26.4 | |
| Democratic | Vin Gopal | 15,392 | 21.9 | |
| Democratic | Kathleen Horgan | 15,060 | 21.5 | |
| Independent | Daniel Jacobson | 2,358 | 3.3 | |
| Total votes | 70,028 | 100.0 | ||
| Republican hold | ||||
District 12
| Party | Candidate | Votes | % | |
|---|---|---|---|---|
| Republican | Ronald S. Dancer (incumbent) | 22,345 | 30.3 | |
| Republican | Robert D. Clifton (incumbent) | 21,469 | 29.1 | |
| Democratic | William Spedding | 15,077 | 20.4 | |
| Democratic | Catherine Tinney Rome | 14,969 | 20.3 | |
| Total votes | 73,860 | 100.0 | ||
| Republican hold | ||||
District 13
| Party | Candidate | Votes | % | |
|---|---|---|---|---|
| Republican | Amy Handlin (incumbent) | 24 073 | 30.5 | |
| Republican | Declan O'Scanlon (incumbent) | 22,754 | 28.8 | |
| Democratic | Patrick Short | 15,333 | 19.4 | |
| Democratic | Kevin Lavan | 15,165 | 19.2 | |
| Constitution Party | Frank C. Cottone | 834 | 1.1 | |
| Constitution Party | William Lawton | 757 | 1.0 | |
| Total votes | 78,916 | 100.0 | ||
| Republican hold | ||||
District 14
| Party | Candidate | Votes | % | |
|---|---|---|---|---|
| Democratic | Wayne DeAngelo (incumbent) | 26,626 | 29.0 | |
| Democratic | Daniel R. Benson (incumbent) | 25,662 | 28.0 | |
| Republican | Sheree McGowan | 19,135 | 20.9 | |
| Republican | Phil Kaufman | 19,100 | 20.8 | |
| Green | Steven Welzer | 1,189 | 1.3 | |
| Total votes | 91,172 | 100.0 | ||
| Democratic hold | ||||
District 15
| Party | Candidate | Votes | % | |
|---|---|---|---|---|
| Democratic | Bonnie Watson Coleman (incumbent) | 20,505 | 32.8 | |
| Democratic | Reed Gusciora (incumbent) | 20,350 | 32.5 | |
| Republican | Kathy Kilcommons | 10,914 | 17.4 | |
| Republican | Peter Yull | 10,817 | 17.3 | |
| Total votes | 62,586 | 100.0 | ||
| Democratic hold | ||||
District 16
| Party | Candidate | Votes | % | |
|---|---|---|---|---|
| Republican | Peter Biondi (incumbent) | 20,359 | 26.9 | |
| Republican | Jack Ciattarelli | 19,770 | 26.1 | |
| Democratic | Joe Carmarota | 17,795 | 23.5 | |
| Democratic | Marie Corfield | 17,779 | 23.5 | |
| Total votes | 75,703 | 100.0 | ||
| Republican hold | ||||
District 17
| Party | Candidate | Votes | % | |
|---|---|---|---|---|
| Democratic | Joseph V. Egan (incumbent) | 15,165 | 31.9 | |
| Democratic | Upendra Chivukula (incumbent) | 14,862 | 31.3 | |
| Republican | Robert Mettler | 8,876 | 18.7 | |
| Republican | Carlo DiLalla | 8,627 | 18.2 | |
| Total votes | 47,530 | 100.0 | ||
| Democratic hold | ||||
District 18
| Party | Candidate | Votes | % | |
|---|---|---|---|---|
| Democratic | Peter J. Barnes III (incumbent) | 18,166 | 28.6 | |
| Democratic | Patrick J. Diegnan (incumbent) | 18,050 | 28.4 | |
| Republican | Joseph Sinagra | 13,996 | 22.0 | |
| Republican | Marcia Silva | 13,333 | 21.0 | |
| Total votes | 63,454 | 100.0 | ||
| Democratic hold | ||||
District 19
| Party | Candidate | Votes | % | |
|---|---|---|---|---|
| Democratic | John Wisniewski (incumbent) | 18,241 | 34.0 | |
| Democratic | Craig Coughlin (incumbent) | 17,492 | 32.6 | |
| Republican | Angel Leon | 9,008 | 16.8 | |
| Republican | Shane Robinson | 8,915 | 16.6 | |
| Total votes | 53,656 | 100.0 | ||
| Democratic hold | ||||
District 20
| Party | Candidate | Votes | % | |
|---|---|---|---|---|
| Democratic | Annette Quijano (incumbent) | 12,116 | 42.7 | |
| Democratic | Joseph Cryan (incumbent) | 12,104 | 42.7 | |
| Republican | John Donoso | 4,128 | 14.6 | |
| Total votes | 28,348 | 100.0 | ||
| Democratic hold | ||||
District 21
| Party | Candidate | Votes | % | |
|---|---|---|---|---|
| Republican | Nancy Munoz (incumbent) | 25,491 | 31.9 | |
| Republican | Jon Bramnick (incumbent) | 25,303 | 31.7 | |
| Democratic | Bruce Bergen | 13,878 | 17.4 | |
| Democratic | Norman Albert | 13,864 | 17.4 | |
| Libertarian Party | Darren Young | 1,324 | 1.7 | |
| Total votes | 79,860 | 100.0 | ||
| Republican hold | ||||
District 22
| Party | Candidate | Votes | % | |
|---|---|---|---|---|
| Democratic | Linda Stender | 15,747 | 30.5 | |
| Democratic | Jerry Green (incumbent) | 14,957 | 29.0 | |
| Republican | Joan Van Pelt | 10,846 | 21.0 | |
| Republican | Jeffery First | 10,062 | 19.5 | |
| Total votes | 51,612 | 100.0 | ||
| Democratic hold | ||||
District 23
| Party | Candidate | Votes | % | |
|---|---|---|---|---|
| Republican | John DiMaio (incumbent) | 21,189 | 31.2 | |
| Republican | Erik Peterson (incumbent) | 21,074 | 30.9 | |
| Democratic | Karen Carroll | 13,369 | 19.6 | |
| Democratic | Scott McDonald | 12,420 | 18.2 | |
| Total votes | 68,152 | 100.0 | ||
| Republican hold | ||||
District 24
| Party | Candidate | Votes | % | |
|---|---|---|---|---|
| Republican | Alison Littell McHose (incumbent) | 19,026 | 30.6 | |
| Republican | Gary Chiusano (incumbent) | 18,561 | 29.8 | |
| Democratic | Leslie Huhn | 10,290 | 16.5 | |
| Democratic | Jim Nye | 9,832 | 15.8 | |
| Constitution | Rose Ann Salanitri | 3,161 | 5.1 | |
| Independent | Mark Quick | 1,382 | 2.2 | |
| Total votes | 62,252 | 100.0 | ||
| Republican hold | ||||
District 25
| Party | Candidate | Votes | % | |
|---|---|---|---|---|
| Republican | Michael Patrick Carroll (incumbent) | 18,481 | 30.0 | |
| Republican | Tony Bucco (incumbent) | 18,218 | 29.5 | |
| Democratic | Gale Colucci | 12,564 | 20.4 | |
| Democratic | George Stafford | 12,432 | 20.2 | |
| Total votes | 61,695 | 100.0 | ||
| Republican hold | ||||
District 26
| Party | Candidate | Votes | % | |
|---|---|---|---|---|
| Republican | Alex DeCroce (incumbent) | 19,696 | 32.0 | |
| Republican | Jay Webber (incumbent) | 19,543 | 31.8 | |
| Democratic | Joseph Raich | 10,847 | 17.6 | |
| Democratic | Elliot Isibor | 10,319 | 16.8 | |
| Green | Michael Spector | 1,095 | 1.8 | |
| Total votes | 61,500 | 100.0 | ||
| Republican hold | ||||
District 27
| Party | Candidate | Votes | % | |
|---|---|---|---|---|
| Democratic | John F. McKeon (incumbent) | 23,508 | 28.0 | |
| Democratic | Mila Jasey (incumbent) | 22,757 | 27.1 | |
| Republican | Lee Holtzman | 18,857 | 22.5 | |
| Republican | Nicole Hagner | 18,790 | 22.4 | |
| Total votes | 83,912 | 100.0 | ||
| Democratic hold | ||||
District 28
| Party | Candidate | Votes | % | |
|---|---|---|---|---|
| Democratic | Cleopatra Tucker (incumbent) | 14,002 | 38.2 | |
| Democratic | Ralph R. Caputo (incumbent) | 13,786 | 37.6 | |
| Republican | Carol Humphreys | 4,607 | 12.6 | |
| Republican | David H. Pinckney | 4,258 | 11.6 | |
| Total votes | 36,653 | 100.0 | ||
| Democratic hold | ||||
District 29
| Party | Candidate | Votes | % | |
|---|---|---|---|---|
| Democratic | L. Grace Spencer (incumbent) | 8,572 | 42.0 | |
| Democratic | Alberto Coutinho (incumbent) | 8,391 | 41.1 | |
| Republican | Elaine Guarino | 1,736 | 8.5 | |
| Republican | Lisa Kistner | 1,687 | 8.2 | |
| Total votes | 20,386 | 100.0 | ||
| Democratic hold | ||||
District 30
| Party | Candidate | Votes | % | |
|---|---|---|---|---|
| Republican | Sean T. Kean (incumbent) | 22,889 | 34.4 | |
| Republican | Dave Rible (incumbent) | 20,728 | 31.2 | |
| Democratic | Shaun O'Rourke | 11,256 | 16.9 | |
| Democratic | Howard Kleinhendler | 10,639 | 16.0 | |
| Libertarian Party (United States) | Davis Schneck | 986 | 1.5 | |
| Total votes | 66,498 | 100.0 | ||
| Republican hold | ||||
District 31
| Party | Candidate | Votes | % | |
|---|---|---|---|---|
| Democratic | Jason O'Donnell (incumbent) | 11,877 | 40.3 | |
| Democratic | Charles Mainor (incumbent) | 11,690 | 39.6 | |
| Republican | Michael Alonso | 3,157 | 10.7 | |
| Republican | Daniel Beckelman | 2,751 | 9.3 | |
| Total votes | 29,475 | 100.0 | ||
| Democratic hold | ||||
District 32
| Party | Candidate | Votes | % | |
|---|---|---|---|---|
| Democratic | Vincent Prieto (incumbent) | 15,753 | 41.5 | |
| Democratic | Angelica M. Jimenez (incumbent) | 15,211 | 40.0 | |
| Republican | Michael Bartulovich | 3,443 | 9.1 | |
| Republican | Ronald Tarolla | 3,249 | 8.5 | |
| Independent | April Tricoli-Busset | 498 | 1.3 | |
| Total votes | 37,974 | 100.0 | ||
| Democratic hold | ||||
District 33
| Party | Candidate | Votes | % | |
|---|---|---|---|---|
| Democratic | Ruben Ramos (incumbent) | 17,444 | 42.7 | |
| Democratic | Sean Connors (incumbent) | 17,064 | 41.8 | |
| Republican | Christopher Garcia | 3,214 | 7.8 | |
| Republican | Fernando Uribe | 3,121 | 7.6 | |
| Total votes | 40,843 | 100.0 | ||
| Democratic hold | ||||
District 34
| Party | Candidate | Votes | % | |
|---|---|---|---|---|
| Democratic | Thomas P. Giblin (incumbent) | 16,285 | 39.1 | |
| Democratic | Sheila Oliver (incumbent) | 15,462 | 37.1 | |
| Republican | Steve Farrell | 4,270 | 10.2 | |
| Republican | Joan Salensky | 4,251 | 10.2 | |
| Independent | Clenard Childress | 813 | 1.6 | |
| Independent | David Taylor | 586 | 1.4 | |
| Total votes | 41,667 | 100.0 | ||
| Democratic hold | ||||
District 35
| Party | Candidate | Votes | % | |
|---|---|---|---|---|
| Democratic | Benjie E. Wimberly | 13,551 | 50.5 | |
| Democratic | Shavonda E. Sumter | 13,143 | 49.0 | |
| Republican | Donna Puglisi | 5,114 | 19.1 | |
| Republican | James Challice | 5,020 | 18.7 | |
| Total votes | 26,828 | 100.0 | ||
| Democratic hold | ||||
District 36
| Party | Candidate | Votes | % | |
|---|---|---|---|---|
| Democratic | Gary Schaer (incumbent) | 17,262 | 30.5 | |
| Democratic | Marlene Caride | 16,319 | 28.8 | |
| Republican | Sara Rosengarten | 11,735 | 20.7 | |
| Republican | John Genovesi | 11,256 | 20.0 | |
| Total votes | 56,572 | 100.0 | ||
| Democratic hold | ||||
District 37
| Party | Candidate | Votes | % | |
|---|---|---|---|---|
| Democratic | Valerie Huttle (incumbent) | 22,062 | 35.9 | |
| Democratic | Gordon M. Johnson (incumbent) | 21,839 | 34.1 | |
| Republican | Keith Jensen | 10,150 | 15.7 | |
| Republican | Gregory Aslanian | 9,929 | 15.4 | |
| Libertarian Party | Julian Heicklen | 675 | 1.0 | |
| Total votes | 64,655 | 100.0 | ||
| Democratic hold | ||||
District 38
| Party | Candidate | Votes | % | |
|---|---|---|---|---|
| Democratic | Connie Wagner (incumbent) | 22,258 | 29.0 | |
| Democratic | Tim Eustace | 21,097 | 27.2 | |
| Republican | Richard Goldberg | 19,091 | 23.3 | |
| Republican | Fernando Alonso | 18,820 | 22.9 | |
| Libertarian Party | Vinko Grskovic | 707 | 0.8 | |
| Total votes | 81,973 | 100.0 | ||
| Democratic hold | ||||
District 39
| Party | Candidate | Votes | % | |
|---|---|---|---|---|
| Republican | Robert Schroeder (incumbent) | 26,572 | 30.9 | |
| Republican | Holly Schepisi | 26,111 | 30.3 | |
| Democratic | Michael McCarthy | 16,200 | 18.8 | |
| Democratic | Anthony Iannarelli Jr. | 15,784 | 18.3 | |
| Independent | Clinton Bosca | 1,425 | 1.7 | |
| Total votes | 86,092 | 100.0 | ||
| Republican hold | ||||
District 40
| Party | Candidate | Votes | % | |
|---|---|---|---|---|
| Republican | David C. Russo (incumbent) | 22,125 | 30.3 | |
| Republican | Scott Rumana (incumbent) | 21,678 | 29.7 | |
| Democratic | Cassandra Lazzara | 15,412 | 21.1 | |
| Democratic | William Brennan | 13,767 | 18.9 | |
| Total votes | 72,982 | 100.0 | ||
| Republican hold | ||||
See Also
References
- ↑ "New Jersey General Assembly elections, 2011". Ballotpedia. Retrieved 15 April 2023.
- 1 2 3 4 5 6 7 8 9 10 11 12 13 14 15 16 17 18 19 20 21 22 23 24 25 26 27 28 29 30 31 32 33 34 35 36 37 38 39 40 41 "2011 Election Results". Secretary of State of New Jersey. December 1, 2011. Retrieved November 1, 2023.