| ||||||||||||||||||||||||||||||||||||||||||||||||||||||||||||||||||||||||||||||||||
All 32 seats to East Ayrshire Council 17 seats needed for a majority | ||||||||||||||||||||||||||||||||||||||||||||||||||||||||||||||||||||||||||||||||||
|---|---|---|---|---|---|---|---|---|---|---|---|---|---|---|---|---|---|---|---|---|---|---|---|---|---|---|---|---|---|---|---|---|---|---|---|---|---|---|---|---|---|---|---|---|---|---|---|---|---|---|---|---|---|---|---|---|---|---|---|---|---|---|---|---|---|---|---|---|---|---|---|---|---|---|---|---|---|---|---|---|---|---|
| Registered | 94,375 | |||||||||||||||||||||||||||||||||||||||||||||||||||||||||||||||||||||||||||||||||
| Turnout | 44.9% | |||||||||||||||||||||||||||||||||||||||||||||||||||||||||||||||||||||||||||||||||
| ||||||||||||||||||||||||||||||||||||||||||||||||||||||||||||||||||||||||||||||||||
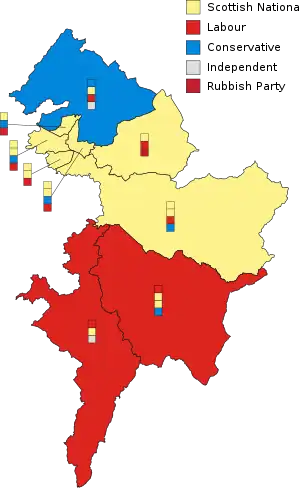 The 9 multi-member wards | ||||||||||||||||||||||||||||||||||||||||||||||||||||||||||||||||||||||||||||||||||
| ||||||||||||||||||||||||||||||||||||||||||||||||||||||||||||||||||||||||||||||||||


Elections to East Ayrshire Council took place on 4 May 2017 on the same day as the 31 other Scottish local government elections. For the second consecutive election, the Scottish National Party (SNP) were returned as the largest party with 14 seats but remained shy of an overall majority. Labour lost further ground but were again returned as the second-largest party with nine seats. The Conservatives made several gains to return six councillors while The Rubbish Party – standing in their first election – won their first seat. Two independent candidates were also elected.
The SNP took over control of the council as a minority administration having previously run the council in coalition with the Conservatives following the previous election in 2012.
Election result
| Party | Seats | Gains | Losses | Net gain/loss | Seats % | Votes % | Votes | +/− | |
|---|---|---|---|---|---|---|---|---|---|
| SNP | 14 | 1 | 2 | 43.8 | 38.5 | 16,023 | |||
| Labour | 9 | 0 | 5 | 28.1 | 25.2 | 10,456 | |||
| Conservative | 6 | 5 | 1 | 18.8 | 24.21 | 10,066 | |||
| Independent | 2 | 1 | 0 | 6.3 | 9.0 | 3,347 | |||
| Rubbish | 1 | 1 | 0 | 3.1 | 1.9 | 784 | New | ||
| Scottish Green | 0 | 0 | 0 | 0 | 1.6 | 674 | New | ||
| Libertarian | 0 | 0 | 0 | 0 | 0.5 | 217 | New | ||
| Total | 32 | 41,567 | |||||||
Source: [1]
Note: "Votes" are the first preference votes. The net gain/loss and percentage changes relate to the result of the previous Scottish local elections on 3 May 2012. This may differ from other published sources showing gain/loss relative to seats held at dissolution of Scotland's councils.[2][3]
Seats changing hands
| Seat | 2012 | 2017 | ||||
|---|---|---|---|---|---|---|
| Party | Member | Party | Member | |||
| Annick | SNP | Eoghann MacColl | SNP | Gordon Jenkins | ||
| Ward increased from 3 to 4 | Conservative | John McFadzean | ||||
| Kilmarnock North | SNP | Elaine Cowan | Conservative | Ian Grant | ||
| Kilmarnock East and Hurlford | Labour | Gordon Cree | Labour | Barry Douglas | ||
| Labour | Drew McIntyre | Conservative | Jon Herd | |||
| Kilmarnock South | SNP | Hugh Ross | SNP | Claire Maitland | ||
| Irvine Valey | Conservative | John McFadzean | The Rubbish Party | Sally Cogley | ||
| SNP | Bobby McDill | Ward decreased from 4 to 3 | ||||
| Ballochmyle | SNP | Stephanie Primrose | SNP | Claire Leitch | ||
| Labour | David Shaw | Conservative | Alyson Simmons | |||
| Cumnock and New Cumnock | Labour | William Menzies | SNP | Jim McMahon | ||
| Labour | Eric Ross | Conservative | Walter Young | |||
| SNP | Kathy Morrice | SNP | Jacqui Todd | |||
| Doon Valley | Labour | Moira Pirie | Independent | Drew Filson | ||
Ward summary
| Ward | % | Cllrs | % | Cllrs | % | Cllrs | % | Cllrs | % | Cllrs | % | Cllrs | % | Cllrs | Total Cllrs |
|---|---|---|---|---|---|---|---|---|---|---|---|---|---|---|---|
| SNP | Labour | Conservative | Rubbish | Green | Libertarian | Independents | |||||||||
| Annick | 32.32 | 1 | 13.51 | 1 | 36.77 | 1 | 4.42 | 0 | 0.11 | 0 | 12.83 | 1 | 4 | ||
| Kilmarnock North | 49.79 | 1 | 23.13 | 1 | 25.96 | 1 | 1.09 | 0 | 3 | ||||||
| Kilmarnock West and Crosshouse | 40.59 | 2 | 23.49 | 1 | 31.27 | 1 | 3.84 | 0 | 1.09 | 0 | 4 | ||||
| Kilmarnock East and Hurlford | 45.14 | 2 | 26.35 | 1 | 21.6 | 1 | 0.78 | 0 | 6.1 | 0 | 4 | ||||
| Kilmarnock South | 54.65 | 2 | 32.89 | 1 | 11.71 | 0 | 0.73 | 0 | 3 | ||||||
| Irvine Valley | 36.29 | 1 | 16.75 | 1 | 19.88 | 0 | 16.94 | 1 | 0.3 | 0 | 9.8 | 0 | 3 | ||
| Ballochmyle | 30.96 | 2 | 28.87 | 1 | 20.1 | 1 | 0.32 | 0 | 13.22 | 0 | 4 | ||||
| Cumnock and New Cumnock | 30.74 | 2 | 35.27 | 1 | 22.21 | 1 | 2.84 | 0 | 0.6 | 0 | 8.31 | 0 | 4 | ||
| Doon Valley | 25.16 | 1 | 34.06 | 1 | 18.33 | 0 | 1.39 | 0 | 0.1 | 0 | 20.92 | 1 | 3 | ||
| Total | 38.54 | 14 | 25.15 | 9 | 18.75 | 6 | 1.88 | 1 | 1.62 | 0 | 0.52 | 0 | 8.95 | 2 | 32 |
Ward results
Annick
Following the Fifth Statutory Review of Electoral Arrangements, Annick was increased from a three-member ward to a four-member ward.[4] The SNP, Labour and independent candidate Ellen Freel retained the seats they had won at the previous election while the Conservatives won the extra seat.
| Party | Candidate | FPv% | Count | ||||||
|---|---|---|---|---|---|---|---|---|---|
| 1 | 2 | 3 | 4 | 5 | 6 | ||||
| Conservative | John McFadzean[note 1] | 36.8 | 2,277 | ||||||
| SNP | Gordon Jenkins | 17.4 | 1,076 | 1,097 | 1,098 | 1,098 | 1,161 | 1,993 | |
| SNP | Eòghann MacColl (incumbent) | 14.9 | 925 | 947 | 948 | 949 | 1,005 | ||
| Labour | John McGhee (incumbent) | 13.5 | 837 | 1,078 | 1,088 | 1,100 | 1,154 | 1,207 | |
| Independent | Ellen Freel (incumbent) | 12.5 | 775 | 1,013 | 1,021 | 1,056 | 1,162 | 1,224 | |
| Scottish Green | Jen Broadhurst | 4.4 | 274 | 326 | 328 | 334 | |||
| Independent | Gordon Walker | 0.3 | 20 | 61 | 66 | ||||
| Libertarian | Amrik Singh | 0.1 | 7 | 22 | |||||
| Electorate: 11,761 Valid: 6,191 Spoilt: 63 Quota: 1,239 Turnout: 53.2% | |||||||||
Source: [5]
Kilmarnock North
Labour retained their only seat while the SNP retained one of their two seats and the Conservatives gained one seat from the SNP.
| Party | Candidate | FPv% | Count | |||||
|---|---|---|---|---|---|---|---|---|
| 1 | 2 | 3 | 4 | 5 | ||||
| SNP | Helen Coffey (incumbent) | 36.9 | 1,381 | |||||
| Conservative | Ian Grant | 26.0 | 971 | |||||
| Labour | Maureen McKay (incumbent) | 23.1 | 865 | 885 | 900 | 924 | 1,300 | |
| SNP | Elaine Cowan (incumbent) | 12.9 | 481 | 884 | 886 | 893 | ||
| Libertarian | Lisa Murray | 1.1 | 41 | 44 | 47 | |||
| Electorate: 9,109 Valid: 3,739 Spoilt: 40 Quota: 935 Turnout: 41.5% | ||||||||
Source: [6]
Kilmarnock West and Crosshouse
The SNP (2), Labour and the Conservatives retained the seats they had won at the previous election.
| Party | Candidate | FPv% | Count | |
|---|---|---|---|---|
| 1 | ||||
| Conservative | Tom Cook (incumbent) | 31.3 | 1,789 | |
| Labour | Lillian Jones (incumbent) | 23.5 | 1,344 | |
| SNP | Iain Linton (incumbent) | 20.5 | 1,171 | |
| SNP | Douglas Reid (incumbent) | 20.1 | 1,152 | |
| Scottish Green | Elizabeth Brown | 3.8 | 220 | |
| Libertarian | Stef Johnstone | 0.8 | 45 | |
| Electorate: 12,631 Valid: 5,721 Spoilt: 88 Quota: 1,145 Turnout: 46% | ||||
Source: [7]
Kilmarnock East and Hurlford
The SNP retained both the seats they had won at the previous election while Labour retained one of their two seats and the Conservatives gained one seat from Labour.
| Party | Candidate | FPv% | Count | |||||||
|---|---|---|---|---|---|---|---|---|---|---|
| 1 | 2 | 3 | 4 | 5 | 6 | 7 | ||||
| SNP | Fiona Campbell (incumbent) | 28.8 | 1,459 | |||||||
| Conservative | Jon Herd | 21.6 | 1,094 | |||||||
| Labour | Barry Douglas | 16.9 | 856 | 867 | 906 | 923 | 933 | 1,007 | 1,513 | |
| SNP | John Campbell (incumbent) | 16.3 | 827 | 1,232 | ||||||
| Labour | Dave Meechan | 9.5 | 479 | 485 | 500 | 510 | 517 | 609 | ||
| Independent | Raymond Pattison | 6.1 | 309 | 313 | 347 | 363 | 383 | |||
| Libertarian | Stephen McNamara | 0.8 | 40 | 41 | 54 | 60 | ||||
| Electorate: 12,244 Valid: 5,064 Spoilt: 129 Quota: 1,013 Turnout: 42.4% | ||||||||||
Source: [8]
Kilmarnock South
The SNP (2) and Labour retained the seats they had won at the previous election.
| Party | Candidate | FPv% | Count | ||
|---|---|---|---|---|---|
| 1 | 2 | ||||
| SNP | Jim Todd (incumbent) | 36.5 | 1,190 | ||
| Labour | John Knapp (incumbent) | 32.9 | 1,073 | ||
| SNP | Clare Maitland | 18.2 | 593 | 914 | |
| Conservative | Billy McClure | 11.7 | 382 | 387 | |
| Libertarian | Caitlin O'Brien | 0.7 | 24 | 29 | |
| Electorate: 8,028 Valid: 3,262 Spoilt: 62 Quota: 816 Turnout: 41.4% | |||||
Source: [9]
Irvine Valley
Following the Fifth Statutory Reviews of Electoral Arrangements, Irvine Valley was reduced in size from a four-member ward to a three-member ward.[4] The SNP retained one of the two seats they had won at the previous election while Labour retained their only seat. The Conservatives lost their only seat and the Rubbish Party won a council seat for the first time.
| Party | Candidate | FPv% | Count | |||||||
|---|---|---|---|---|---|---|---|---|---|---|
| 1 | 2 | 3 | 4 | 5 | 6 | 7 | ||||
| SNP | Elena Whitham (incumbent) | 24.4 | 1,128 | 1,131 | 1,132 | 1,179 | ||||
| Conservative | Susan McFadzean | 19.9 | 920 | 921 | 922 | 964 | 964 | 989 | ||
| Rubbish | Sally Cogley | 16.9 | 784 | 788 | 792 | 888 | 889 | 1,036 | 1,403 | |
| Labour | George Mair (incumbent) | 16.8 | 775 | 778 | 780 | 879 | 880 | 991 | 1,233 | |
| SNP | Margaret Young | 11.9 | 551 | 551 | 551 | 587 | 605 | |||
| Independent | Ian King | 9.5 | 438 | 438 | 444 | |||||
| Independent | David Gartland | 0.3 | 16 | 16 | ||||||
| Libertarian | Stevie Brannagan | 0.3 | 14 | |||||||
| Electorate: 9,677 Valid: 4,626 Spoilt: 71 Quota: 1,157 Turnout: 48.5% | ||||||||||
Source: [10]
Ballochmyle
The SNP retained both the seats they had won at the previous election while Labour retained one of their two seats and the Conservatives gained one seat from Labour.
| Party | Candidate | FPv% | Count | |||||||
|---|---|---|---|---|---|---|---|---|---|---|
| 1 | 2 | 3 | 4 | 5 | 6 | 7 | ||||
| SNP | Claire Leitch | 20.7 | 971 | |||||||
| Conservative | Alyson Simmons | 20.1 | 944 | |||||||
| Labour | Neil McGhee (incumbent) | 18.6 | 873 | 875 | 875 | 880 | 1,233 | |||
| SNP | Jim Roberts (incumbent) | 16.8 | 788 | 813 | 813 | 816 | 854 | 895 | 1,107 | |
| Independent | David Shaw (incumbent) | 13.2 | 621 | 621 | 622 | 627 | 671 | 734 | ||
| Labour | Neil Murray | 10.3 | 483 | 483 | 484 | 485 | ||||
| Libertarian | Sheraz Shafiq | 0.3 | 15 | 15 | 15 | |||||
| Electorate: 11,270 Valid: 4,695 Spoilt: 138 Quota: 940 Turnout: 42.9% | ||||||||||
Source: [11]
Cumnock and New Cumnock
Labour retained one of the three seats they won at the previous election while the SNP retained their only seat and both the SNP and the Conservatives gained one seat from Labour.
| Party | Candidate | FPv% | Count | |||||||
|---|---|---|---|---|---|---|---|---|---|---|
| 1 | 2 | 3 | 4 | 5 | 6 | 7 | ||||
| Labour | Billy Crawford (incumbent) | 28.7 | 1,279 | |||||||
| Conservative | Walter Young | 22.2 | 991 | |||||||
| SNP | Jacqui Todd | 16.4 | 731 | 740 | 743 | 745 | 773 | 831 | 898 | |
| SNP | Jim McMahon | 14.4 | 641 | 656 | 659 | 660 | 684 | 743 | 812 | |
| Independent | Jessie Owens | 8.3 | 371 | 390 | 411 | 418 | 461 | |||
| Labour | Carol Ann Mochan | 6.6 | 295 | 577 | 599 | 605 | 626 | 736 | ||
| Scottish Green | Peter Black | 2.8 | 127 | 136 | 143 | 149 | ||||
| Libertarian | Gordon Bircham | 0.6 | 27 | 28 | 32 | |||||
| Electorate: 10,735 Valid: 4,462 Spoilt: 137 Quota: 893 Turnout: 42.8% | ||||||||||
Source: [12]
Doon Valley
The SNP retained their only seat while Labour retained one of their two seats and independent candidate Drew Filson gained a seat from Labour.
| Party | Candidate | FPv% | Count | |||||||||
|---|---|---|---|---|---|---|---|---|---|---|---|---|
| 1 | 2 | 3 | 4 | 5 | 6 | 7 | 8 | 9 | ||||
| Labour | Elaine Dinwoodie (incumbent) | 21.0 | 801 | 801 | 807 | 828 | 848 | 1,182 | ||||
| Conservative | Alison Harper | 18.3 | 698 | 699 | 701 | 718 | 721 | 737 | 756 | 757 | ||
| Independent | Drew Filson | 15.5 | 590 | 590 | 596 | 685 | 693 | 777 | 838 | 844 | 1,066 | |
| SNP | John Bell (incumbent) | 15.3 | 583 | 583 | 592 | 602 | 935 | 950 | 972 | |||
| Labour | Elaine Stewart | 13.0 | 496 | 496 | 502 | 522 | 526 | |||||
| SNP | Anne Fairlie | 9.9 | 375 | 375 | 390 | 399 | ||||||
| Independent | John Young | 5.4 | 207 | 208 | 213 | |||||||
| Scottish Green | Craig Murray | 1.4 | 53 | 54 | ||||||||
| Libertarian | Mark Mitchell | 0.1 | 4 | |||||||||
| Electorate: 8,920 Valid: 3,807 Spoilt: 76 Quota: 952 Turnout: 43.5% | ||||||||||||
Source: [13]
Notes
- ↑ Sitting councillor for Irvine Valley.
References
- ↑ Teale, Andrew. "Local Elections Archive Project - 2017 - East Ayrshire". Retrieved 21 October 2022.
- ↑ Faulds, Allan. "The Local STV Voting System Explained". Ballot Box Scotland. Retrieved 24 October 2022.
- ↑ "Single Transferable Vote". Electoral Reform Society. Retrieved 24 October 2022.
- 1 2 "Fifth Statutory Review of Electoral Arrangements; East Ayrshire Council Area" (PDF). Local Government Boundary Commission for Scotland. May 2016. Retrieved 26 October 2022.
- ↑ "Detailed Results Report Ward 1 - Annick" (PDF). East Ayrshire Council. 5 May 2017. Retrieved 25 April 2022.
- ↑ "Detailed Results Report Ward 2 - Kilmarnock North" (PDF). East Ayrshire Council. 5 May 2017. Retrieved 26 April 2022.
- ↑ "Detailed Results Report Ward 3 - Kilmarnock West and Crosshouse" (PDF). East Ayrshire Council. 5 May 2017. Retrieved 28 April 2022.
- ↑ "Detailed Results Report Ward 4 - Kilmarnock East and Hurlford" (PDF). East Ayrshire Council. 5 May 2017. Retrieved 2 May 2022.
- ↑ "Detailed Results Report Ward 5 - Kilmarnock South" (PDF). East Ayrshire Council. 5 May 2017. Retrieved 3 May 2022.
- ↑ "Detailed Results Report Ward 6 - Irvine Valley" (PDF). East Ayrshire Council. 5 May 2017. Retrieved 4 May 2022.
- ↑ "Detailed Results Report Ward 7 - Ballochmyle" (PDF). East Ayrshire Council. 5 May 2017. Retrieved 5 May 2022.
- ↑ "Detailed Results Report Ward 8 - Cumnock and New Cumnock" (PDF). East Ayrshire Council. 5 May 2017. Retrieved 2 November 2022.
- ↑ "Detailed Results Report Ward 8 - Doon Valley" (PDF). East Ayrshire Council. 5 May 2017. Retrieved 2 November 2022.